Table of Contents
Why We Need This Article
I started teaching high school math and physics in Ottawa Ontario in 2022. I was shocked at how inconsistent and unsystematic the grading process was. I knew this was the case for language and project-based courses but I didn’t expect the math and science assessments to be so subjective and unreliable. Every teacher has their style and philosophy for grading. Some teachers are known to be tougher graders than others. Students don’t always know what’s expected of them. Teachers don’t always know what they expect from their students due to a lack of clarity in the provincial curriculum. To make things worse, every district assigns grades differently. In short, it’s the Wild West out there.
I’ve spent the last three years researching and experimenting with better ways of grading math at the high school level. I did my undergrad in mathematics and my master’s degree in statistics. I recently got accepted for my PhD in educational psychometrics starting in September 2025. This article aims to paint a picture of the Ontario grading system and propose a path forward. I hope this article offers some overarching principles and practical tips that may inform your practice.
The Purpose of Grading
Most of the confusion and harmful grading practices stem from a lack of clarity on the purpose of grading. Here’s what our provincial assessment policy has to say:
The primary purpose of assessment and evaluation is to improve student learning.
Growing Success – Page 6
To “improve student learning”, Ken O’Connor implores that “we must have a shared vision of the primary purpose of grades: to provide communication in summary format about student achievement of learning goals. This requires that grades be accurate, meaningful, consistent, and supportive of learning”. The summary format is important to emphasize. Teachers must distill tens of hours of interactions and marking into a few letters or numbers. It’s impossible to get it perfectly right. It’s a miracle that the current haphazard process of handing out grades offers useful information to students, teachers, parents, guidance counsellors, next-year teachers, and post-secondary institutions.
Predictive Validity
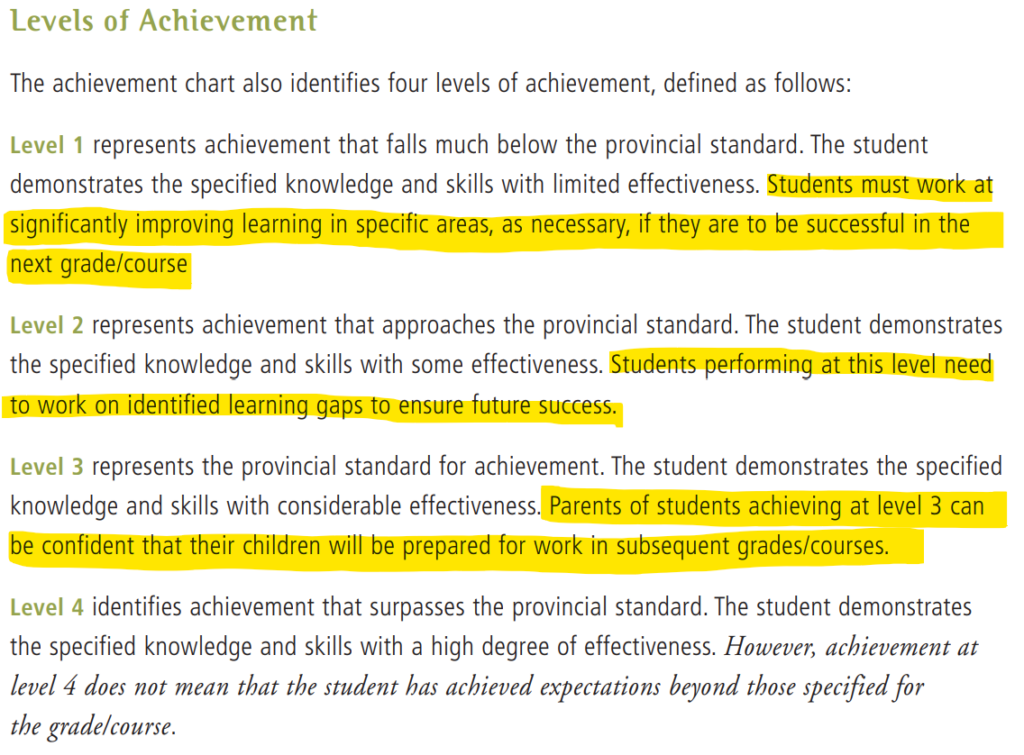
Growing Success defines the performance standards below in terms of readiness for future courses (page 18):
The highlighted sentences above confirm the importance of grades having a certain predictive validity. As a statistician, I wish they could be more precise about their notion that “parents of students achieving at level 3 can be confident that their children will be prepared for work in subsequent courses”. They could analyze grades and determine that obtaining a level 3 in grade 9 math (MTH1W) should give the student a 75% probability of obtaining a level 3 or higher in grade 10 math (MPM2D). You can read more about setting performance standards from Gregory J. Cizek.
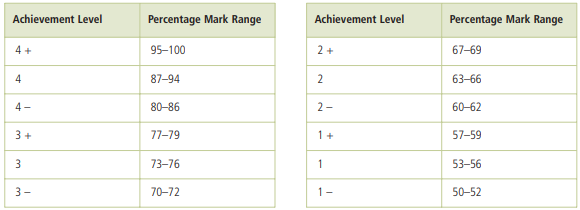
Below is an example of a reasonable quantification of Growing Success‘ levels of achievement. We see that a student achieving level 1 in the previous course only has a 25% of reaching level 3 or 4 in the next course. Thus, this student must invest significant resources to succeed in the next course. A level 2 student has a 50% chance to meet the provincial standard in the following course. It makes sense that we don’t want our success to depend on a coin toss and thus should aim for a level 3 or higher.
| Grade in the current course | Probability of level 3 or higher in next year’s course |
| R | <10% |
| Level 1 | 25% |
| Level 2 | 50% |
| Level 3 | 75% |
| Level 4 | 90% |
The guidelines above could be used to validate the grades you assign as a teacher. Do most of your level 3 students obtain a level 3 or higher in the following course? If not, maybe you are too generous. Or perhaps next year’s teacher is too harsh. Regardless, analyzing the predictive validity of grades is a key step forward in improving the accuracy and utility of grades. I built this spreadsheet to help you analyze the predictive validity of your grades. The good news is that experienced teachers have a large sample size that can be analyzed retrospectively. Yearly analysis of grades within a school is time well invested.
Learning Targets
Returning to the purpose of grading, Rick Stiggins adds that “both student and teacher must know where the learner is now, how that compares to ultimate learning success, and how to close the gap between the two.” It’s important to emphasize that a useful grading system relies on clear provincially set learning targets. Luckily, our curriculum distills courses into key learning goals (power standards). For example, below are the overall and specific expectations for the new destreamed grade 9 math course (MTH1W). Each overall expectation is the second half of the sentence: “By the end of this course, students will”.
| STRAND AA: Social-Emotional Learning (SEL) Skills in Mathematics This overall expectation is to be included in classroom instruction, but not in assessment, evaluation, or reporting. |
| AA1. develop and explore a variety of social-emotional learning skills in a context that supports and reflects this learning in connection with the expectations across all other strands |
| STRAND A: Mathematical Thinking and Making Connections This strand has no specific expectations. Students’ learning related to this strand takes place in the context of learning related to strands B through F, and it should be assessed and evaluated within these contexts. |
| A1. apply the mathematical processes to develop a conceptual understanding of, and procedural fluency with, the mathematics they are learning |
| A2. make connections between mathematics and various knowledge systems, their lived experiences, and various real-life applications of mathematics, including careers |
| STRAND B: Number |
| B1. demonstrate an understanding of the development and use of numbers, and make connections between sets of numbers |
| B2. represent numbers in various ways, evaluate powers, and simplify expressions by using the relationships between powers and their exponents |
| B3. apply an understanding of rational numbers, ratios, rates, percentages, and proportions, in various mathematical contexts, and to solve problems |
| STRAND C: Algebra |
| C1. demonstrate an understanding of the development and use of algebraic concepts and of their connection to numbers, using various tools and representations |
| C2. apply coding skills to represent mathematical concepts and relationships dynamically, and to solve problems, in algebra and across the other strands |
| C3. represent and compare linear and non-linear relations that model real-life situations, and use these representations to make predictions |
| C4. demonstrate an understanding of the characteristics of various representations of linear and non-linear relations, using tools, including coding when appropriate |
| STRAND D: Data |
| D1. describe the collection and use of data, and represent and analyse data involving one and two variables |
| D2. apply the process of mathematical modelling, using data and mathematical concepts from other strands, to represent, analyse, make predictions, and provide insight into real-life situations |
| STRAND E: Geometry and Measurement |
| E1 demonstrate an understanding of the development and use of geometric and measurement relationships, and apply these relationships to solve problems, including problems involving real-life situations |
| STRAND F: Financial Literacy |
| F1. demonstrate the knowledge and skills needed to make informed financial decisions |
It may seem like an overwhelming amount of learning targets at first sight. However, social-emotional learning (Strand AA) is not graded and mathematical thinking and making connections (Strand A) is to be evaluated through the other strands. This leaves us with 11 overall expectations. These can be colloquially summed up as: By the end of the course, students will understand and use:
- Number sets
- Exponents
- Proportional thinking
- Algebraic expressions and equations
- Basic coding
- Linear equations and simple linear regression
- Basic data management and visualizations
- Basic geometry: perimeter, area, volume, measurement, triangles, circles
- Basic financial math: budgets & interest rates
If people think 11 standards are too many to grade and report, then perhaps we teach too many distinct things. Alternatively, a grade per strand could be reported. For MTH1W, the power-standards would be:
- Number
- Algebra
- Data
- Geometry and Measurement
- Financial Literacy
A hierarchical way to think about grades might be useful. A single grade could be offered at the end of the course as a composite score of the overall expectations. This is similar to the Hierarchical Taxonomy Of Psychopathology (HiTOP).
Universities may only consider the composite score but students can benefit from the fine-grained information contained in the standard-level data. It’s always better to have access to precise data that can be aggregated than the other way around. Knowing that a student achieved at 72% in MTH1W makes it impossible to know how they did in algebra.
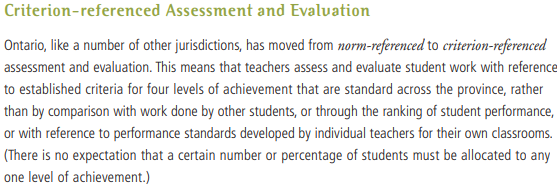
Criterion-referenced Versus Norm-referenced
The purpose of grading in high school is not to sort students from least to most proficient. Instead, the goal is to determine achievement relative to standards instead of relative to each other. Grades are trying to answer the following questions: “Did the student acquire the learning goals of the course? Are they ready for the next course? What do they need to review?” Or at a systemic level: “What proportion of students obtained a level 3 or higher?” If the proportion of successful students is too low, it likely signals that students lacked the prerequisite skills or it is indicative of poor teaching practices.
Mastery Learning
The objective of teaching is to bring as many students as possible to a mastery level (Level 3 or higher, ideally level 4) on the curriculum‘s overall and specific expectations.
Mastery learning was first proposed by Benjamin Bloom in 1968. He postulated that:
Most students, perhaps over 90 percent, can master what teachers have to teach them, and it is the task of instruction to find the means which will enable students to master the subject under consideration. A basic task is to determine what is meant by mastery of the subject and to search for methods and materials which will enable the largest proportion of students to attain such mastery.
The vast majority of students can excel and truly master the Ontario curriculum. The curriculum was designed with this in mind as it doesn’t teach differential equations to four-year-olds.
Mastery doesn’t imply perfection. Perfection is not a human endeavour. There needs to be wiggle room for misreading a question or making little mistakes in calculation. In fact, it’s rare for teachers to get 100% on their own assessments.

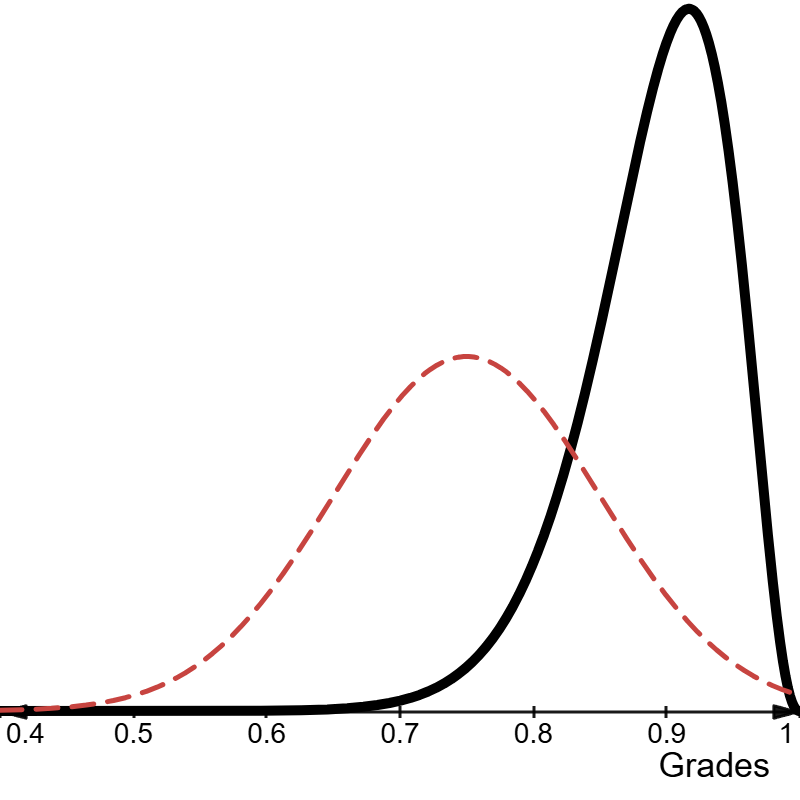
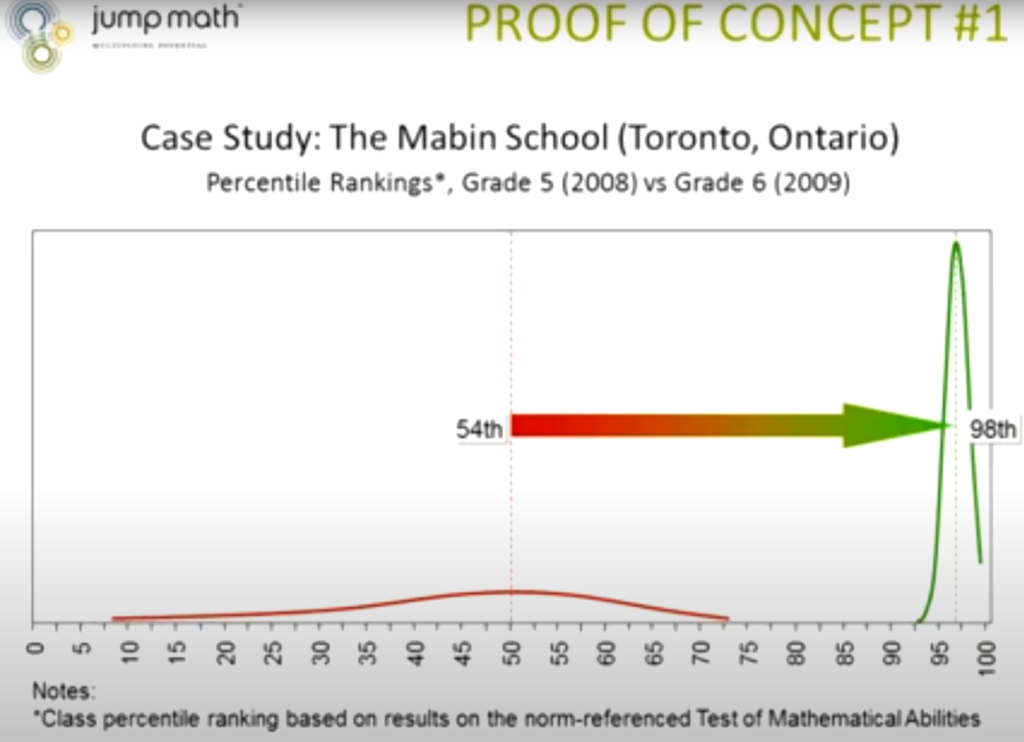
It’s important to recognize that mastery lies on a spectrum. More precisely, the function of teachers is to shift the normal distribution to the upper end of the performance range. Here’s what Bloom had to say on the topic:
There is nothing sacred about the normal curve. It is the distribution most appropriate to chance and random activity. Education is a purposeful activity and we seek to have the students learn what we have to teach. If we are effective in our instruction, the distribution of achievement should be very different from the normal curve. In fact, we may even insist that our educational efforts have been unsuccessful to the extent to which our distribution of achievement approximates the normal distribution.
Important Definitions
Learning goals, learning targets, learning standards, and learning expectations are considered synonymous in this article.
We’ll differentiate between marking and grading. Marking is going through a task and searching for evidence of learning. It’s putting Xs, checkmarks, and comments. Grading is the process of assigning a grade. It’s crucial to separate the two processes.
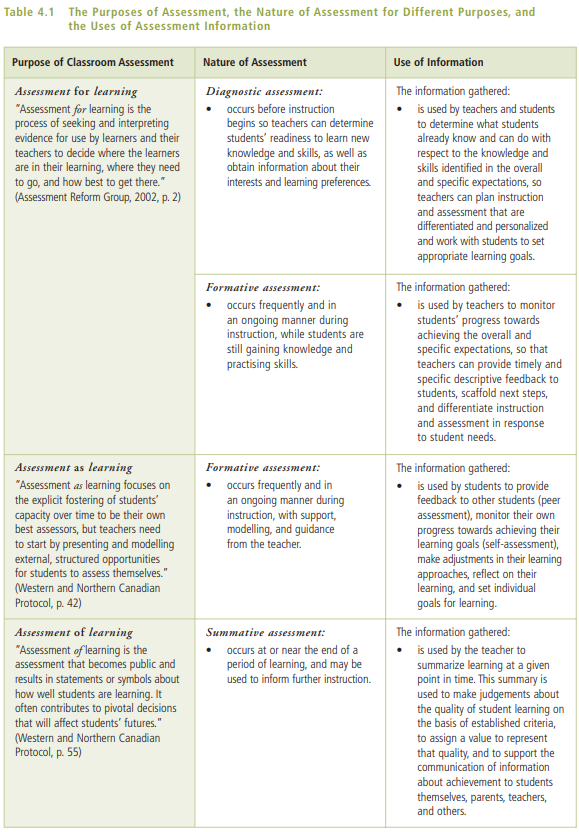
The three types of assessments mentioned in Growing Success are displayed in the table below.
- Diagnostic
- Formative
- Summative
Triangulation
A useful analogy for summative assessments contrasted with formative assessments is to compare students to musicians practicing versus performing at a concert. Musicians need a ton of practice to learn new skills. They have the clear learning goal of playing a series of songs for a concert at a pre-determined date. The music teacher will engage in continual feedback loops with the learners. Informal formative assessment will be omnipresent. Near the concert date, they’ll do a formal rehearsal to simulate the concert performance. Musicians should be ready by this last rehearsal and do only a few minor tweaks. By this point, every learner should feel prepared to perform and do reasonably well.
On the day of the concert, they get (summatively) assessed by the audience and judges. They might even get a grade if there are prizes for different performances. It’s important to note that, in this analogy, the judges don’t attend practices. They don’t adjust the score of the concert performance based on how well or how poorly they played during practices. The audience isn’t there during practices to boo the learners on every mistake or applaud every correct note.
Mistakes are an inherent part of the learning process. This is why summative assessments should usually be near the end of the learning cycle to give students time to master the learning targets.
Categories of Knowledge and Skills
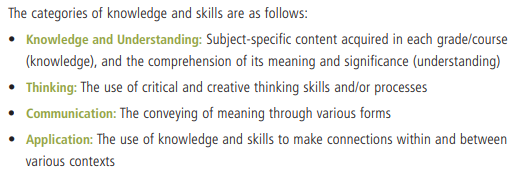
Many school boards assign grades for each category of knowledge and skills below for each summative task.
This is a bad idea for several reasons.
First, Growing Success explicitly states that “assessment and evaluation will be based on both the content standards and the performance standards. … The achievement chart for each subject/discipline is a standard province-wide guide and is to be used by all teachers as a framework within which to assess and evaluate student achievement of the expectations in the particular subject or discipline.”
Second, the construct validity of the four categories is highly suspect. Statistical techniques such as factor analysis consistently point to a single latent trait explaining most of the variability of ability test scores. Mathematical ability appears to be unidimensional. Growing Success acknowledges this by saying that the “four categories should be considered as interrelated, reflecting the wholeness and interconnectedness of learning.” In other words, the four categories don’t exist. They are arbitrary lines in the sand and share some overlap. For example, even after reading their definitions, it’s not trivial what the differences are between knowledge, understanding, thinking, and application. These are superfluous terms. The overall expectations, on the other hand, are concrete. Solving linear equations is a thing you can observe in the world. Does a computer program that solves linear equations understand linear equations?
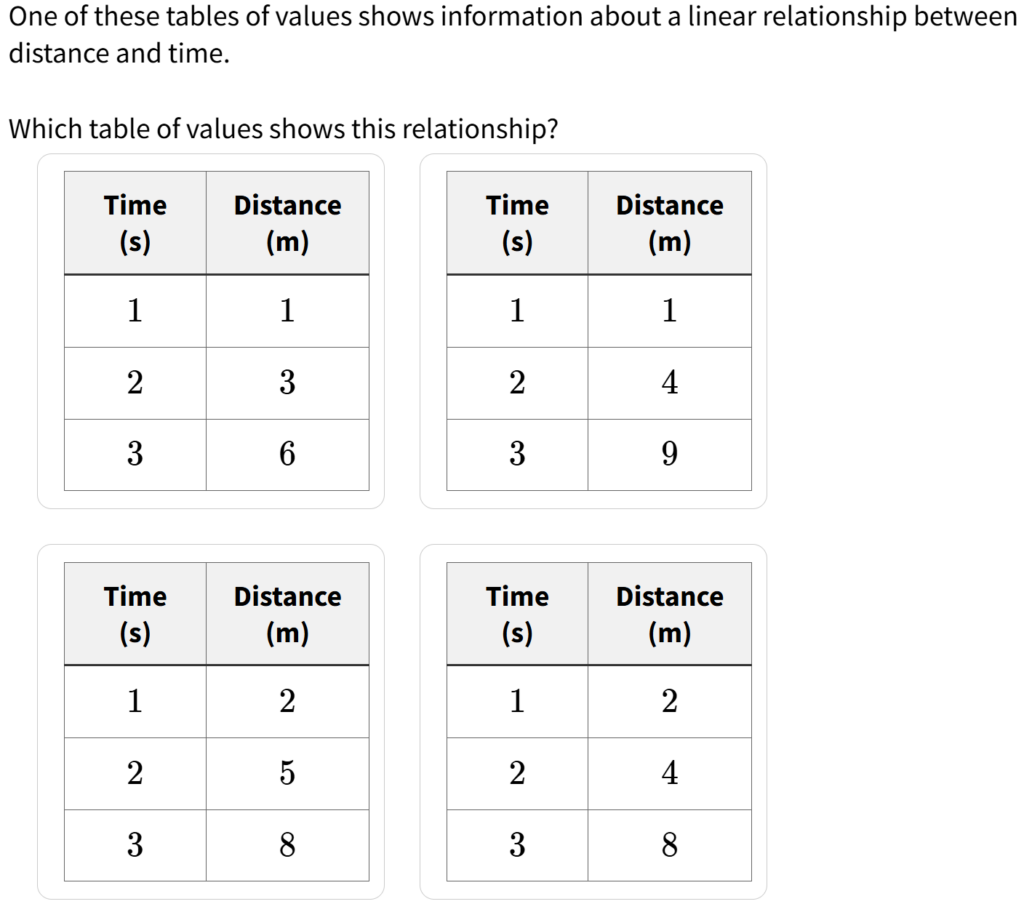
Consider this question below taken from the grade 9 provincial practice test. Is this a knowledge, understanding, thinking, or application question? Or is it a combination of the categories?
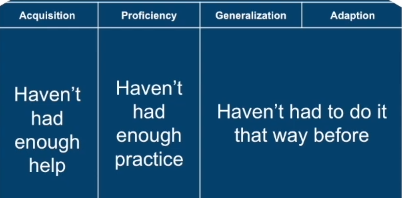
Many scholars draw different lines in the sand. Bloom’s taxonomy is probably the most famous example. Alternatively, the instructional hierarchy is another model. It’s difficult to believe that the four categories are real and all the other models are wrong. A healthy dose of skepticism is warranted.
Third, even if the four categories existed, they are almost surely not transferable skills as they are branded in Growing Success. They’re not “common to both the elementary and secondary panels and to all subject areas and disciplines.” Sure, using your brain should happen in every course, but knowledge of verbs in French class doesn’t translate to knowledge of number facts. Critical thinking in a reading task is probably not the same as critical thinking in the mathematical context. Yet, grades are assigned on these categories and comparisons are made across units, subjects, and courses.
There is no qualitative difference between knowledge and understanding. It is knowledge all the way down. Understanding just means we have richer connections between relevant knowledge in the schemas in long-term memory.
Greg Ashman
What often ends up happening in practice is that thinking and application are considered harder questions while knowledge and understanding are reserved for easier items. Teachers intuitively map the item difficulty onto the verbs according to something like Bloom’s taxonomy and then order the questions accordingly.
Generalization and transfer of knowledge and skill to new contexts seem to be at the pinnacle of the mastery process. So generalization and transfer of knowledge and skill to new contexts have to be taught and formatively and summatively assessed. Artificial intelligence also struggles with extrapolation and interpolation. The further the task is from the training data, the worse you can expect the answers to be. Out-of-sample predictions are always worse than in-sample ones. Similarly, students do better on questions that resemble the ones in the homework. Evolution has equipped human beings with this incredible ability to learn from a few examples and transfer this new understanding to new contexts.
Fourth, grades should be comparable between teachers and schools at the provincial level. Assigning grades to competencies prevents comparisons because teachers assess different things in each category. A level 3 in thinking on the unit 1 test is meaningless for comparison. In contrast, a level 3 on solving linear equations has inherent meaning.
Fifth, grades in the four categories don’t offer useful feedback. What do you say to a student with an aggregated level 2 in application across units? In contrast, it’s clear what feedback and recommendations could be made to a student with a level 2 in solving linear equations. Making the switch would better align with the primary purpose of grades: “to improve student learning.”
Sixth, the communication category often artificially inflates math grades. Growing Success says that: “Teachers will ensure that student learning is assessed and evaluated in a balanced manner with respect to the four categories, and that achievement of particular expectations is considered within the appropriate categories.” Allocating roughly 25% of the grade might make sense in certain courses but certainly not in math. It’s a common occurrence to see a student fail the knowledge, understanding, thinking, and application parts of a test while excelling in communication. The excessive weight given to communication in math courses adds noise to the prediction of future performance. Adding communication as one of the overall expectations seems to be a reasonable compromise. Communication would count towards roughly 1/12 of the grade assuming equal weight to each expectation. Ultimately, the weight of communication should not add too much noise to the predictive validity of grades. This could be validated empirically.
Lastly, it is an empirical question as to whether or not assigning grades to standards versus the four categories will lead to better predictions of future performance. I hypothesize that standard-based grading will outperform categorical grading in predicting future performance. The weighted composite score of standards will be a better predictor than the weighted average of the four categories.
To be fair, the “categories help teachers to focus not only on students’ acquisition of knowledge but also on their development of the skills of thinking, communication, and application.” (page 17) Teachers historically assessed shallow acquisition of knowledge instead of generalization and transfer. An easy way to remedy this is to provide clearer performance standards with examples of tasks with student answers that meet the provincial standard.
Assessment Plan
A key advantage of standards-based grading is that teachers must become familiar with the curriculum. With clear learning targets in mind, teachers can build assessments that provide them enough information to make informed inferences about student’s achievement of learning goals.
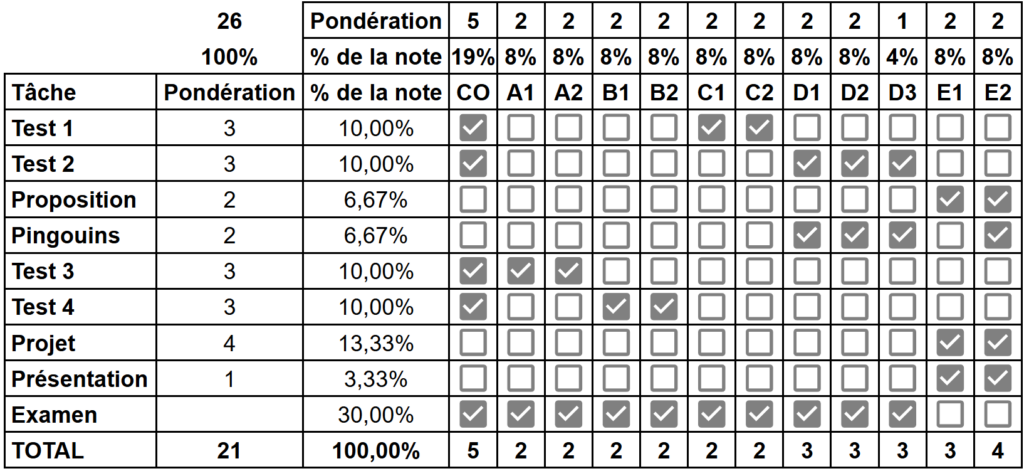
An assessment plan can be established before building instructional content. The rows in the table below represent each summative task for my grade 12 statistics course MDM4U. The columns represent the 12 overall expectations for the course.
By the end of this course, students will analyse, interpret, and draw conclusions from one-variable data using numerical and graphical summaries.
Overall expectation D1 from MDM4U
We can see that the overall expectation D1 is assessed three times: on test 2, on the penguin data analysis project, and on the exam. This is enough evidence to make an informed judgement on where the student falls relative to the learning target. The measurements are longitudinal and varied which should increase the accuracy of the grade. Ideally, the teacher would have at least three pieces of evidence per standard before they assign a grade. Of course, this would increase the marking workload and can be attained by allowing students to retake an assessment if they’re unsatisfied with their grade.
An assessment plan like the one above ensures that all standards can be accurately measured. It also provides a structure to plan the instructional content (backward design). Furthermore, this assessment plan should be communicated to students and parents at the beginning of the course for transparency. Students can better manage their time and allocate their resources if they know how much each summative assessment is worth.
Grading Is Not Objective
Grading of student learning is inherently subjective. This is because it involves so many choices by teachers, including what is assessed, what criteria and standards it is assessed against, and the extent to which students meet the standards. Teachers must not apologize for this subjectivity, but they must also ensure that it does not translate into bias, because faulty grading damages students (and teachers). For example, a student who receives lower grades than she deserves might decide to give up on a certain subject or drop out of school, while a student who gets higher grades than he deserves might find himself in a learning situation where he cannot perform at the expected level of competence.
Ahead of the Curve
The Average Is Rarely the Most Accurate Final Grade
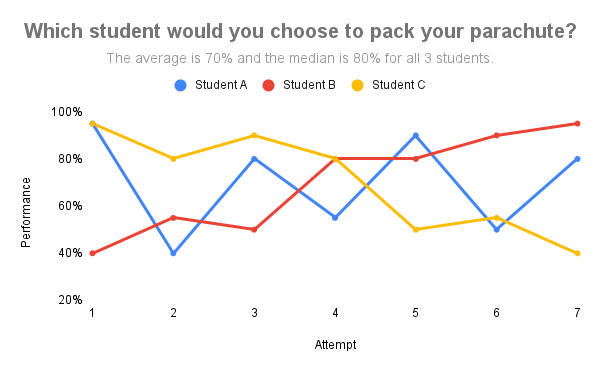
Consider the example below from Ken O’Connor’s lecture to drive home the point. Which student would you choose to pack your parachute by the end of the seven attempts?
Most people answer that student B should pack the parachute at the end of the semester. Yet those three students share the same average and median. It’s rare to see students A and C in practice. Why would a student who completed a task fail to replicate their performance on the same task later down the road? Taking the average would not represent student B‘s ability. It penalizes learning instead of rewarding it. The mean is also sensitive to outliers. As a result, an early zero has a massive impact on the grade despite more recent evidence of ability.
It’s important to remember that the purpose of grades is to provide information about where the student is relative to the learning goal. Student B has met the learning goal and is ready for the next course while this might not be the case for student C.
The report card grade represents a student’s achievement of overall curriculum expectations, as demonstrated to that point in time. Determining a report card grade will involve teachers’ professional judgement and interpretation of evidence and should reflect the student’s most consistent level of achievement, with special consideration given to more recent evidence.
Growing Success
Evidence records
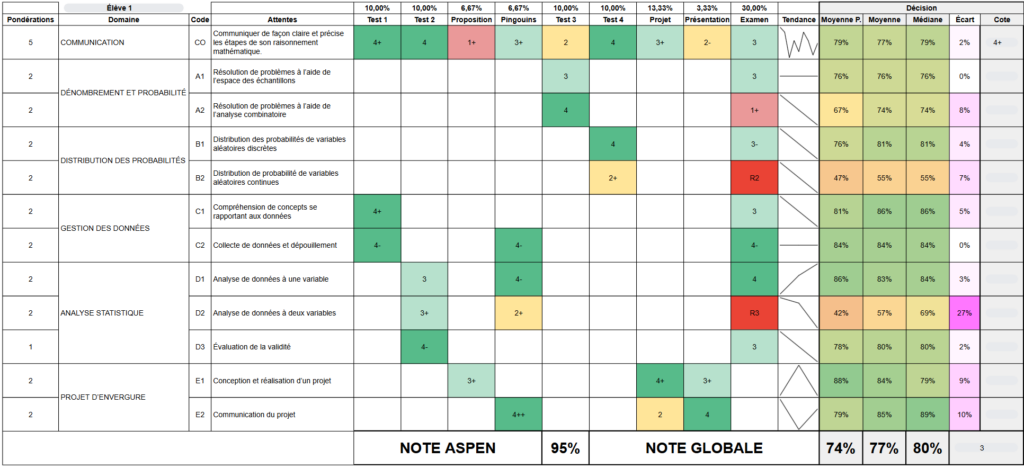
A key piece of the puzzle to provide accurate professional judgements is to build an evidence record of student performance on the summative assessments. Below is an example of a dashboard that allows the teacher to perform inference on a student’s mastery of the learning targets.
You can see longitudinal data for each standard in each row. The trendline, weighted average, average, and median are calculated to help the teacher triangulate a letter grade. Bayesian updating may prove useful in not only reporting a grade but the uncertainty around it. Assessing the same standards at different times and in different ways is key to valid inferences.
The Issue With Points
A student who gets 10/10 on an easy quiz containing strictly level two questions should not be counted as 100%. A level 4+ indicates that the student “surpasses the provincial standard” and is “prepared for work in subsequent grades/courses”. This student should get a level 2 because they’ve shown they’re able to solve questions easier than the learning target. Blind point-to-percentage conversion should be avoided. Points give the illusion of objectivity, but they are both distributed and marked arbitrarily. Points can aid professional judgment but should not be used blindly.
The Issue With Percentages
A 72% in math doesn’t mean much. Does it mean that the student understands roughly three-quarters of the concepts? Or does it mean that they understand every concept but not in-depth? It’s analogous to going to the mechanic and they tell you your car’s health is at 72% when it’s just the brakes that need changing and everything else is fine. Providing a level or letter grade on each standard that is anchored to clear levels of performance provides more useful feedback.
Percentages are intuitive and nearly universal in the education system. Converting levels into percentages to take the weighted average of the course expectations at the end of the course may be a reasonable compromise. You can create a copy of the spreadsheet to see how it is done in my courses.
Proficiency Scales
Proficiency scales offer more useful information than percentages. This is assuming that a level 3 in math means the same thing across the province. The Ministry of Education ought to provide student work samples to help teachers, students, and parents understand the meaning of each level on the proficiency scale.
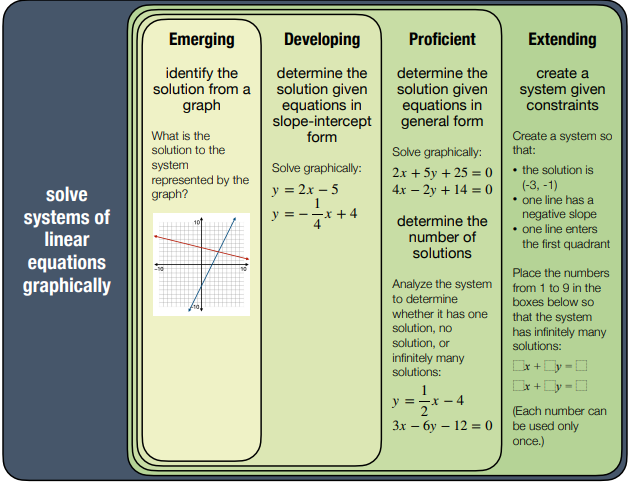
Below is an example of the new British Colombia scale.
No scale is perfect. First, adding words such as emerging, developing, proficient, and extending appears to add more confusion than it aimed to resolve. The order of the words is not immediately obvious. For this reason, symbols such as A, B, C, D, F or R, 1, 2, 3, 4 should be adopted. Second, the emerging level appears too broad. A category for no or very little understanding needs to be added. The province also needs to decide whether it makes sense to pass students in the emerging category if they have close to zero chance of being proficient in the following course. Lastly, the word “complete” in the proficient category is misleading. A student who gets the concepts and is able to apply it in most circumstances is ready for the next course.
Below is how Chris Hunter thinks of the proficiency levels. Each question or parts of questions can be taught as checking whether or not a student reached a certain level of proficiency. Here‘s an example of a unit test to give you a better idea.
The challenge with this approach is that a student never answers all the level 1, 2, 3 questions and none of the level 4 questions. In reality, a proficient student will answer most of the easy questions correctly and struggle with the more complex questions. They’ll make random mistakes and might get lucky on a few questions. Their thinking might be good but they punched something wrong in their calculator. Assessment is inherently subjective. The professional judgement of the teacher ought to triumph over blind logic rules. We try to fit students into the neat little boxes of the proficiency scale but it rarely works mindlessly.
For math courses, the province should provide many sample questions of level 3 for each standard and teachers can create items that assess the other levels. Here are some solutions to convert the levels to percentages (Chris Hunter, Marzano, Langley).
Not All Zeros Are Created Equal
A zero on the percentage scale is a huge outlier because zero is half the scale away from a level 1 which is worth around 55%. On the other hand, a zero on the 0, 1, 2, 3, 4 scale is only one-quarter of the scale away from level 1. Hence, a zero on the level scale is less of a drag when taking the average than a zero on the percentage scale.
| 0 | 1 | 2 | 3 | 4 |
Are Multiple Choice Questions Objective?
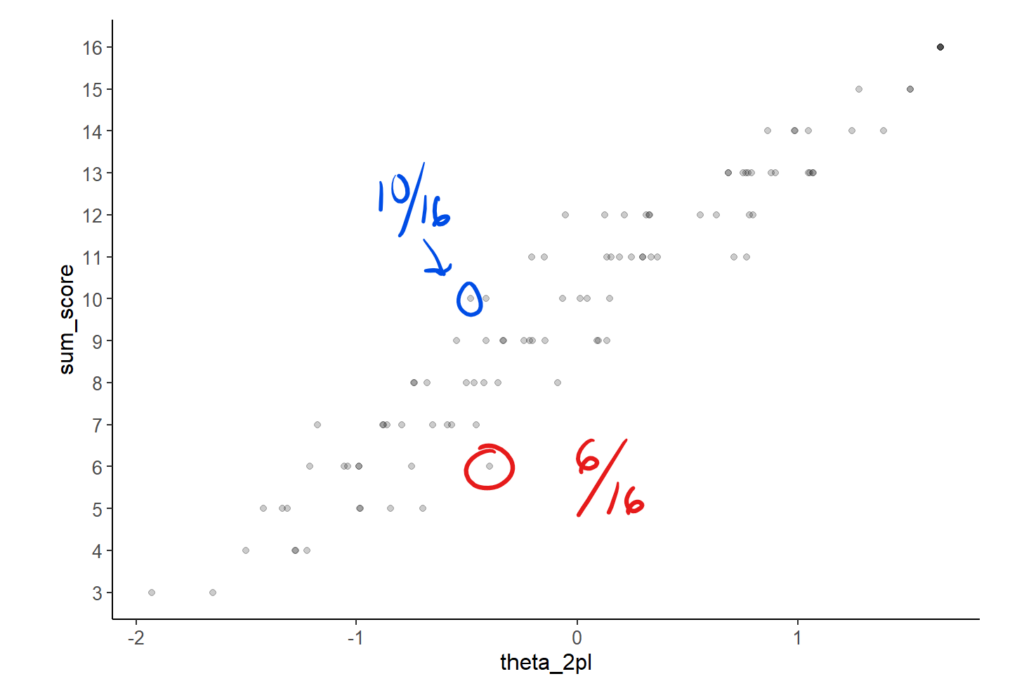
Even multiple-choice questions are not objective. If a student scores 10/16 on a quiz, should they automatically receive a better grade than a student who scores 6/16? Intuitively, the answer is yes. However, this approach (sum score) does not consider the difficulty of the questions. What if the 6/16 students answer all the hardest items correctly?
Item Response Theory (IRT) is a statistical technique that allows us to estimate the ability of students while controlling for the question difficulty, discrimination, and guessability. As seen below, the 6/16 has a higher estimated math ability (theta_2pl) than the 10/16 student. Many standardized tests such as the EQAO and PISA use IRT to assign grades based on multiple-choice questions.
Allow Reassessments When Possible
Allowing students to retake an assessment is a highly debated topic in education. It’s useful to go back to the purpose of grading to inform our practices. “The primary purpose of assessment and evaluation is to improve student learning.” (page 6) Getting a level 2 on a learning goal indicates that the student needs “to work on identified learning gaps to ensure future success.” (page 18) It only makes sense to provide students the opportunity to display their mastery on another assessment once they worked on the “identified learning gaps.” The teachers should want as many students as possible to master the curriculum expectations.
The two main arguments against retakes are that:
- there are often no second chances in real life;
- allowing retakes is not feasible as it adds too much marking.
The first argument is appealing at first glance but is simply not the case. A student can retake the driver’s license test, they can apply to medical school twice, can apply for a job every time a position opens and learn from the feedback after each rejection. Sure, there are one-time events in life that you ought to be prepared for. Final exams are an example of this. It’s just not possible to allow indefinite retakes on final exams due to administration guidelines. Report cards need to be sent at a specific date. That said, given the predictive purpose of grading, we want to know if students can pack their parachutes by the end of the course.
The second argument is legitimate as teachers have a finite amount of time. Allowing retakes increases teacher workload. Teachers need to build other assessments and spend time marking the retakes. Below are a few tips and observations to make the retake process feasible.
- Every school should have a success centre where students rewrite their tests or benefit from extra help. This frees up the teacher’s time to not have to miss their lunch or stay outside the school hours for a student to retake a test. It also ensures that kids don’t miss class time and fall further behind. This also deters students from not studying for the initial date because no one wants to get to school an hour earlier to rewrite a test.
- In an academic utopia, a support period could be built into the schedule of every student.
- Collaborate with your department to share and reuse old assessments. There’s no need to reinvent the wheel every year.
- Alternatively, use a question bank software to randomly create assessments of similar difficulty and automatically generate the answer keys. This could free up teacher time while reducing the risk of students sharing solutions with students who need a retake.
- Assessing by standard instead of category of knowledge and skills speeds up the retake process. A student doesn’t need to retake the entire test if they only struggled with one standard. Why get a new car if you need to change the brakes? This also speeds up the grading process.
- Not all standards must be mastered to ensure success in the following courses. The teacher can only allow reassessments of the core standards to encourage mastery.
The most efficient and effective way to measure knowledge is the multiple-choice test.
Thomas Haladyna
- Multiple-choice questions can speed up grading while assessing the categories of knowledge and skills. Communication could be assessed separately by asking students to show their steps. Many math tests such as the Waterloo contests are purely multiple-choice questions and no one would argue that these tests encourage memorization, rote procedures, and shallow understanding.
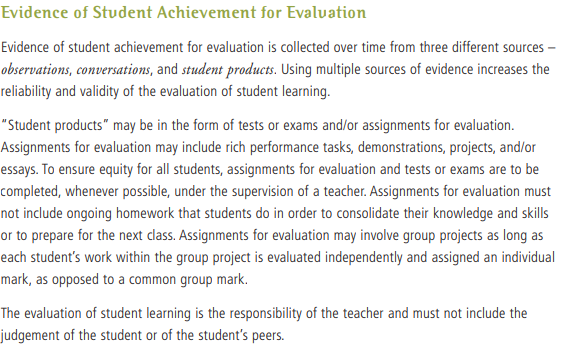
- Don’t grade homework. They have the solutions and can always ask you if they have any questions. You can do a few homework problems with the entire class as a way to review the previous day’s lesson and reteach the key concepts.
- Don’t leave extensive comments on a summative assessment. Students benefit from identifying and fixing their mistakes (see Dylan Williams for more in Ahead of the Curve). You can ask students to submit a copy of the test where they have fixed their mistakes.
- Tell students to use a highlighter for the final answer and instruct them how to communicate effectively. It speeds up marking.
From experience, not many students opt for retakes as they are time and energy-consuming. It’s much easier to learn the material on the first try than to restudy and show up to school earlier or stay later to write the test. Furthermore, many students are okay with mediocrity. They are completely ok with a level 2. Below are a few things I’ve implemented or seen other teachers implement successfully to limit the number of unproductive retakes:
- I max out the total number of attempts to three. The curriculum is fast-paced. There’s no time to linger on unit 1 while learning unit 4.
- I require my students to submit all the relevant homework in Google Classroom before being allowed a retake.
- I also quiz them verbally before allowing a retake to ensure that they’ve learned something since their first attempt. Otherwise, it’s a waste of everyone’s time.
- I require students to submit a revised version of the test.
- You can set a cutoff date for redos a couple of weeks before the final exam.
Report Behaviours Separately From Grades
The development of learning skills and work habits is an integral part of a student’s learning. To the extent possible, however, the evaluation of learning skills and work habits, apart from any that may be included as part of a curriculum expectation in a subject or course, should not be considered in the determination of a student’s grades. Assessing, evaluating, and reporting on the achievement of curriculum expectations and on the demonstration of learning skills and work habits separately allows teachers to provide information to the parents and student that is specific to each of the two areas of achievement.
Growing Success – Page 10
Grades are meant to reflect the student’s achievement of curriculum expectations. A student who hands in a project a few hours past the deadline should not be given a lower grade.
One objection to this practice may be that this is unfair to students who handed it in on time. This line of argument doesn’t hold up because students usually have ample time to finish a project. The deadlines are an arbitrary line in the sand to incentivize students to manage their time (Parkinson’s law). Deadlines also help the teacher manage their time by marking all the copies simultaneously. The student doesn’t “win” by stretching already generous deadlines. They end up falling behind.
Another criticism of not lowering grades for late work is that there is predictive validity in the student’s learning skills and work habits. It’s no surprise that students with good time management and organization skills tend to perform better in school. Consequently, it seems justified to penalize late work since these adjusted grades are going to be better predictors.
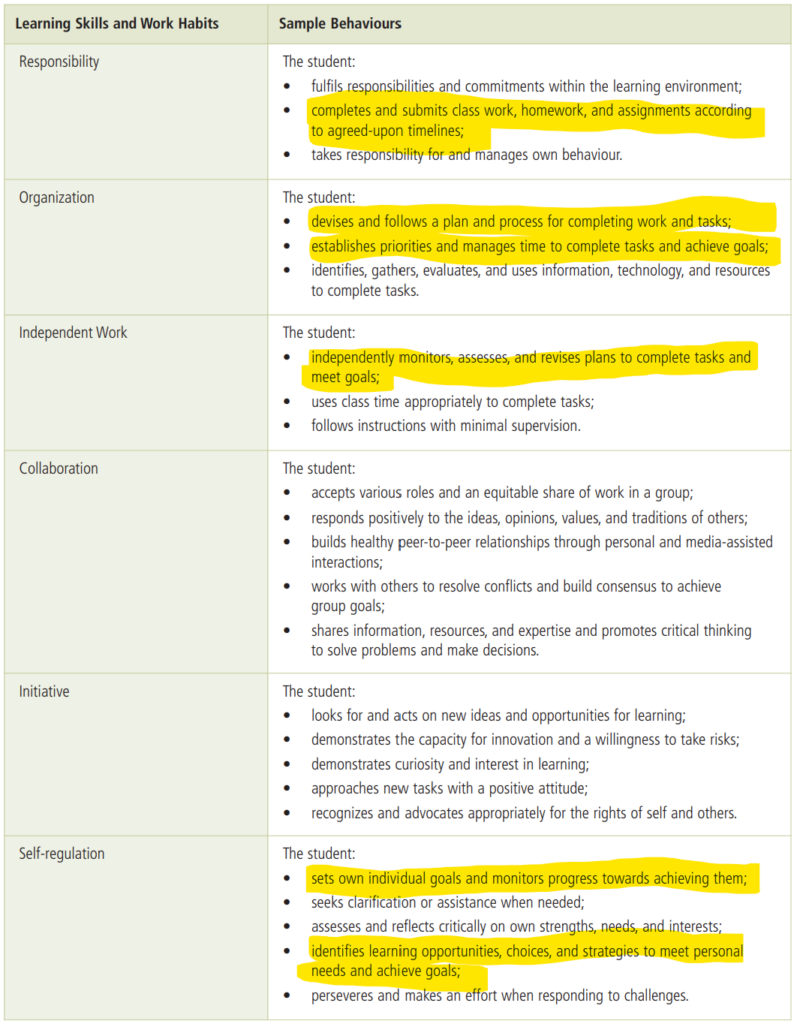
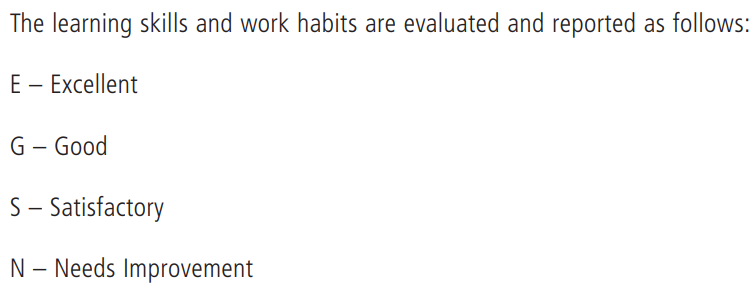
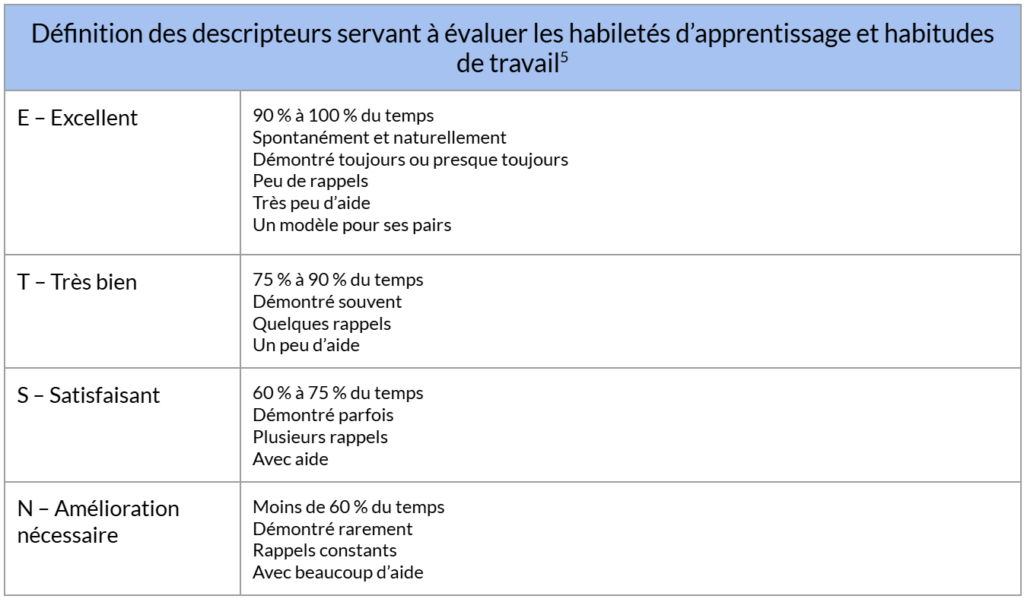
It’s more sensible to report behaviour separately from academic achievement of curriculum expectations and provide the students the support they need to submit on time in the future. A student who hands in a great project late should have a high grade with a low behavioural score. This approach aligns well with the retake approach. Students are incentivized to hand in their work on time to receive feedback and resubmit a better version of the project. In Ontario, we have identified the following learning skills and work habits as predictors of future success.
More research should be done on the reliability and validity of the six learning skills and work habits. It’s not clear that these are real distinct latent constructs that could be picked up by a factor analytic approach. Just consider the highlighted sample behaviours above. They seem to all refer to the same underlying trait. Furthermore, I’ve yet to see research demonstrating the predictive validity of the six learning skills and work habits and the reliability of the grading process of the learning skills. It’s not obvious what a G for Good means. A frequency scale for behaviours seems more appropriate.
Most universities and colleges currently only look at grades for admissions. This will change if it’s shown that the scores on learning skills and work habits have distinct information that can help programs predict which students will excel and which are likely to fail or drop out.
Grades should be based on what each student has learned. Nothing else matters. We infer a level of learning, and thus assign a grade, based on the data collected on each student during the course.
Thomas Haladyna
Absence of Evidence Is Not Evidence of Absence
A missing grade or a case of plagiarism is not evidence of a lack of mastery. Instead, it reflects on poor learning skills and work habits and hence, should not impact the grade. All we can conclude is that there is “insufficient evidence” to provide a grade. A student who handed in everything and finished the course with a 60% is different from a student with 90s in everything except the one project which was submitted late and ended up with a 60%. The 60% should have the same predictive validity.
If grades are to be valid measures of a student’s achievement of the standards, then zeros should not be factored into the grade and an “I” for “insufficient evidence” should be reported. I like O’Connor’s line of reasoning on how to deal with missing work or plagiarism. He suggests behavioural consequences for plagiarism and that we ask ourselves the following question:
Do I have enough evidence to make a valid and reliable judgment of the student’s achievement?
If the answer is yes, the grade should be determined without the missing piece. More often than not, the answer will be no and the grade should be recorded as “I” for “Incomplete” or “Insufficient evidence.” This symbol communicates accurately that, while the student’s grade could be anywhere from an A to an F, at the point in time when the grade had to be determined, there was insufficient evidence to make an accurate judgment.
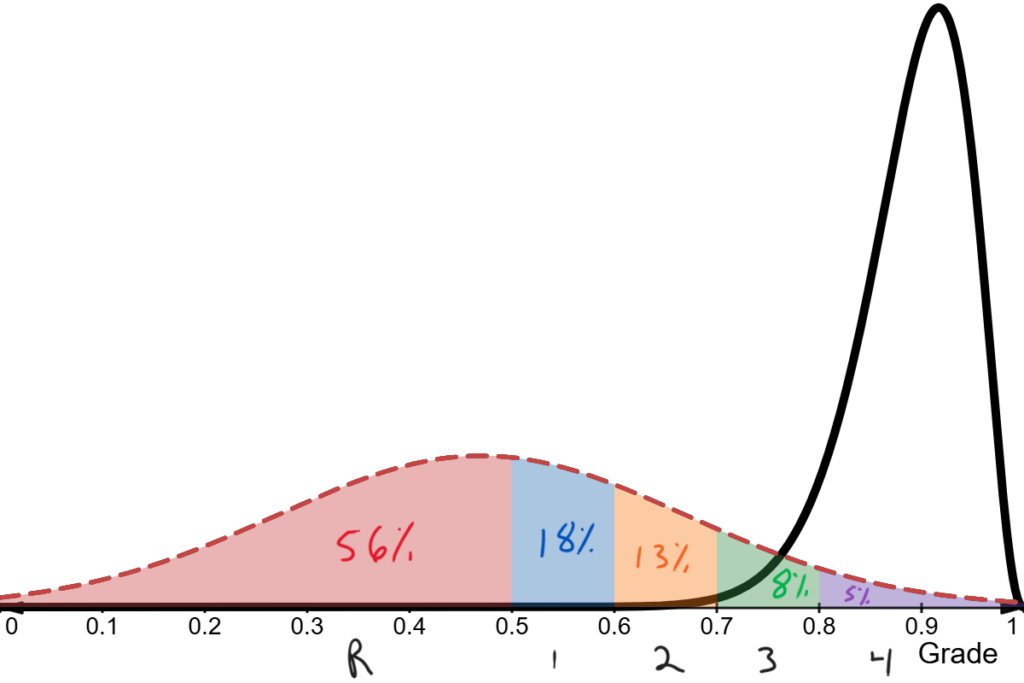
In statistical parlance, we could say that there is too much uncertainty or measurement error around the estimate. We can be confident that the student with the black distribution has met the learning targets and should receive a level 4. The same cannot be said about the student with the red distribution. 56% of the area under the posterior estimate of the red student is in the R range. However, this same student has 44% of their ability distribution with a passing grade. The measurement error of a single assessment is often too large to reliably assign a grade. Education data and updated ability estimates through repeated measures are fertile ground for Bayesian inference which would report the uncertainty around the estimates.
To be clear, students cannot pass the course with a missing grade (“I”) on any of the course expectations. That said, standards-based grading offers the possibility for credit remediation. Students only need to display proficiency on these standards to recover the credit. This targeted approach saves time and prevents the necessity of retaking an entire course when only a few concepts needed to be learned.
A Few Grading Principles
Below are a few practical implications of the theoretical framework we’ve proposed in this article. You can consult Ken O’Connor’s work for more suggestions.
Don’t Grade Attendance
The purpose of grades is to determine if the learner is prepared to succeed in the following courses. Do they display mastery of the learning standards? If yes, it doesn’t matter how many days they missed and they shouldn’t be penalized.
From a predictive validity perspective, it could be the case that a level 3 with 20 missed days is predicted to perform better than a level 3 with zero absences. If a student was able to meet the course expectations while missing so much school, imagine what they could achieve if they were present. The challenge with attendance data is that no two absences are the same. Consider the following reasons for missing class:
- Sporting event
- Family funeral
- Mental health event
- Concussion or serious health injury
- Having to take care of someone at home
- Having to work
- Missing the bus
- Not having a ride to school because their parents didn’t feel like getting out of bed
- Skipping class
- Showing up 30 minutes late because they were working on a project from another course
- Skipping class because it’s a revision period and the student knows they’re more productive at home
- Being involved in school activities
Not all absences are created equal. Some absences likely have positive predictive power while others don’t. Overall though, there is a negative association between missing lectures and the final grade in that course. The main effect of attendance is indirectly captured in the student’s impaired ability to learn course material. Directly penalizing students would disproportionally impact less privileged students.
Don’t Grade Group Work
Social loafing is a well-documented phenomenon. The grade starts to lose some of its predictive power if the other members of the group inflate or deflate it. One could argue that making friends with productive teammates is a useful skill that will continue to pay dividends in the following courses. The objection to grading group work is that the grade assesses whether or not the student has met the learning expectations. Social skills should be reported separately as learning skills and work habits unless they are course expectation.
This doesn’t mean that teachers can’t assign group work. It just implies that the grade must be differentiated for each group member or that group projects are to be given formatively.
Limit Projects Done At Home
The same can be said for big projects done over a semester. Students can benefit from the help of friends, family, and tutors. This can further increase socioeconomic bias and decrease the predictive validity of grades.
Here’s what Growing Success has to say on the subject:
Don’t Give Out Bonus Marks
Giving bonus marks for anything that doesn’t have to do with learning targets should be avoided. Examples of bonus points for:
- Attendance
- Participation
- Pointing out mistakes in the lecture notes
- Bringing material to class
- Taking part in extracurricular activities
- Donating to charity
- Handing in homework
All of the examples above are examples of behaviours and should be reported as learning skills and work habits.
Final Exams
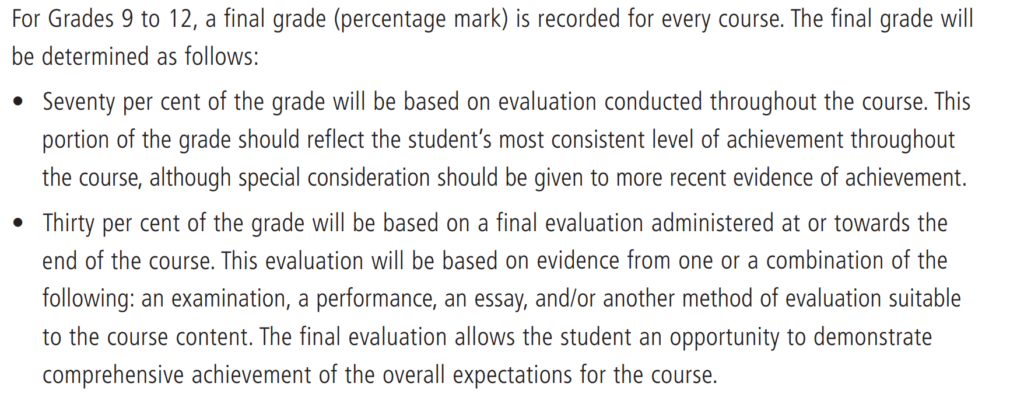
Final cumulative exams or performance assessments are typically a good practice. They encourage students to learn the material for long-term retention instead of just cramming for the unit test. They force students to engage in spaced repetition. It also prepares them for university exams and other professional exams such as the driving test, the MCAT and so on.
Final exams align perfectly with the evidence record approach. They provide a last opportunity for students to display their learning since the initial unit test. The 70-30 split is arbitrary and should be viewed more as a guideline than a rule. It could also be eliminated completely and emphasis could be put on the more recent evidence. Quality exams should help the teacher determine if the student can pack their parachute with “considerable effectiveness”.
One caveat is that final exams can be slightly easier than unit tests. Assessing all the expectations in 90 minutes cannot provide the same depth and quality of assessment as assessing a couple of expectations in 75 minutes. Below are our district’s guidelines (PED-20) for the duration of exams for each grade. In grades 9 and 10, it’s a challenge to include enough items to reliably assign a grade on each standard.
| Grade | Duration (hours) |
| 9 | 1.5 |
| 10 | 1.5 |
| 11 | 2.5 |
| 12 | 2.5 |
Another advantage of exams is that the province or school boards can design harmonized assessments. Teachers can design their instruction with the same learning targets in mind. A common high-quality assessment will help ensure a certain depth and breadth of instruction. There is no better way to communicate performance standards to teachers and students than to provide examples of questions that students should be able to answer.
Standardized Tests
Standardized tests offer the same benefits as harmonized final exams. They add the additional benefit of having an external measurement that helps you validate and triangulate your grades. Students who perform well in the course should perform well on the provincial test. Of course, longitudinal data should allow for more accurate and precise ability estimates than cross-sectional data. Stepping on a scale every few weeks for a semester tells a more informative story than stepping on a scale once near the end of the semester. This is true even if the final scale is more calibrated than the scale used during the semester.
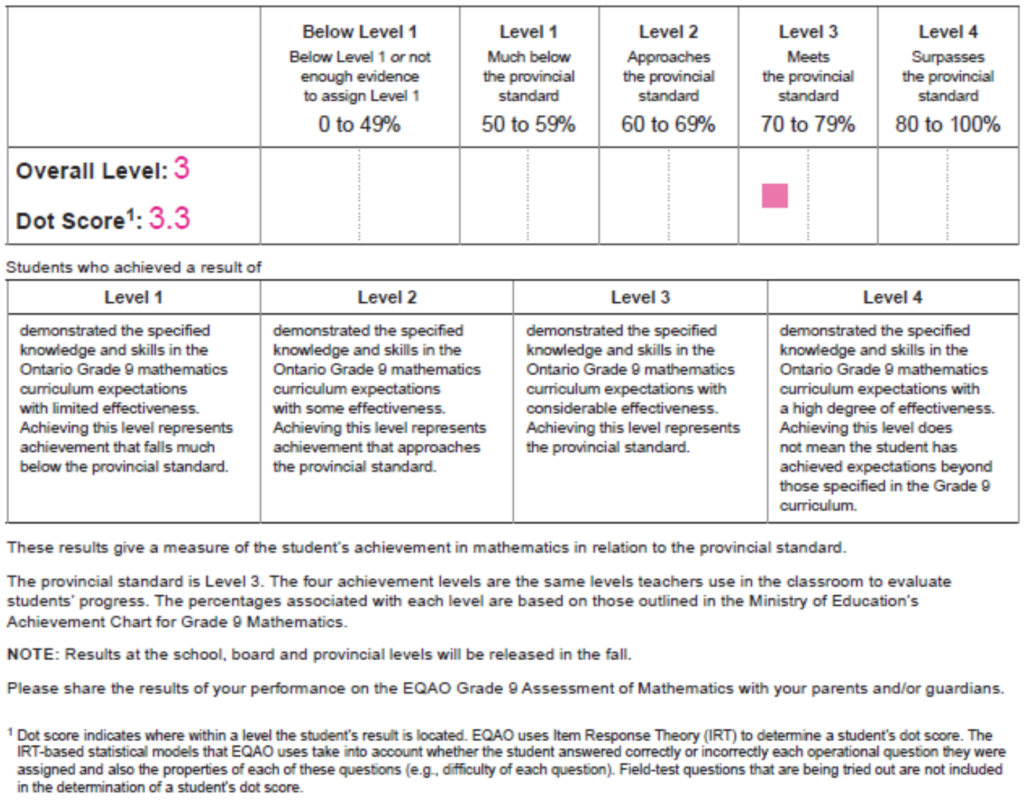
Ideally, standardized tests like the EQAO grade 9 math test would provide a grade on each standard. Teachers could add a column to their evidence record with the standardized grade. The typical approach for grade nine math teachers is to allocate 70% of the weight to coursework, 20% to the exam, and a minimum of 10% to the provincial test. Below is a sample report from the provincial test.
The main reason why EQAO doesn’t provide a grade for each standard is that the test would take too much time. Grade 9 teachers currently dedicate two 75-minute periods to provincial testing. It seems realistic to assign a grade on each of the 11 MTH1W standards in 150 minutes. This results in roughly 13 minutes per standard assuming equal importance. Adding an extra period would result in 225 minutes or roughly 20 minutes per standard. A student should be able to answer roughly 10 to 15 questions in that amount of time. Fully adaptive tests could provide reasonably precise estimates of proficiency on each standard.
Adaptive Tests
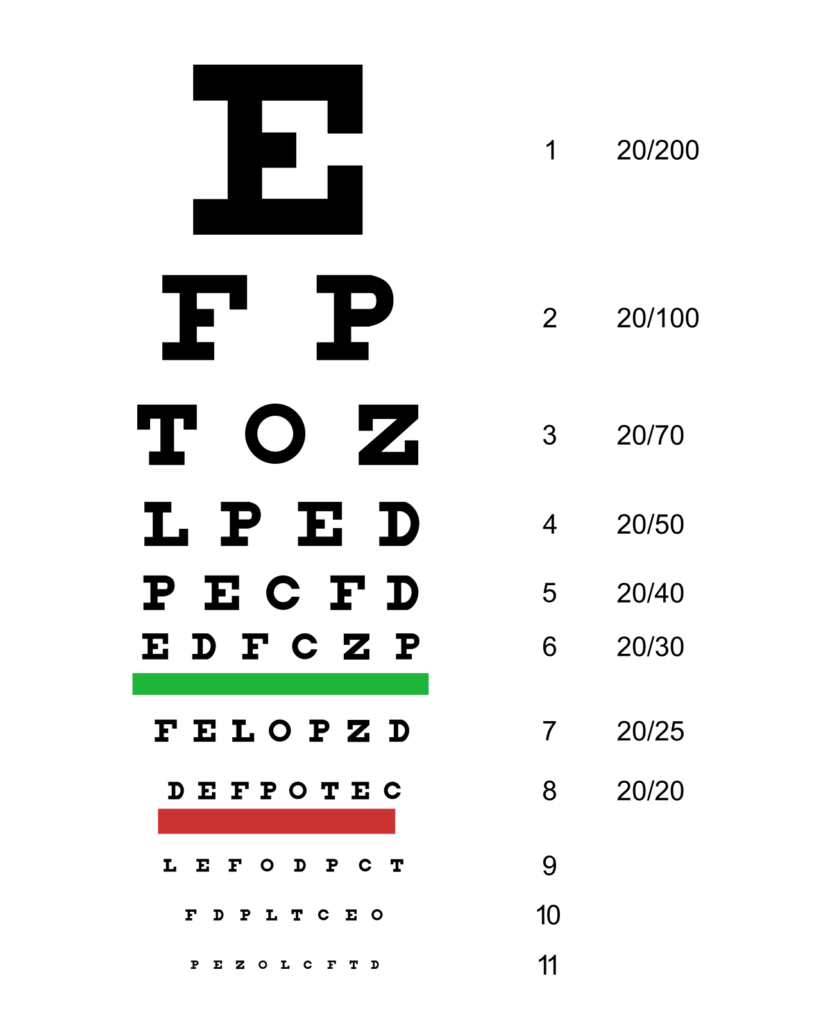
A good way to think about adaptive tests is to compare it to a vision exam. Imagine that the patient is successful on the first six lines above but fails to identify most letters on line seven. It’d be a waste of time and information to go through lines 8 through 11. Instead, the optometrist could add line 6.5 to check if the patient can reliably name those new letters. If so, they could add line 6.7. If the patient is successful on 6.5 but not 6.7, then the optometrist can conclude that the patient’s ability is somewhere between 6.5 and 6.7. This result is not only more accurate but also requires less time to obtain than going through the entire test. The optometrist could speed things up further by starting with line four instead of line one.
The typical pencil and paper unit tests we give our students are not adaptive. A low-proficiency student will attempt to get through an entire exam even though they can barely do the basics. This wastes the students’ time and is demoralizing. Furthermore, it wastes the teacher’s time who has to mark the entire test. Wrong answers where students are trying to get part marks are especially tedious to mark.
Computerized adaptive testing can get around this limitation. You can watch this brilliant introduction to Item Response Theory (IRT) by Ben Stenhaug to learn more about how modern standardized tests operate. In short, adaptive testing strives to keep students in their zone of proximal development (ZPD) resulting in faster, more accurate, and more engaging tests.
Better Report Cards
Report cards summarize a student’s achievement of the overall expectations and their learning skills and work habits. The purpose of this data is to provide information to students, parents, teachers, and post-secondary institutions so they can make informed decisions. Should report cards display the grade on each standard or display only the overall grade? In my opinion, adding roughly ten to fifteen numbers per course adds useful information without overwhelming the reader with data. Furthermore, it aligns with the primary purpose of assessment and evaluation “to improve student learning.”
One way to organize the report could be to have a summary section with only the composite learning and behaviour scores with another more detailed section with each expectation grade. Here’s how Marzano designs their report cards. Universities, for example, may determine that the subscore of algebra is particularly predictive of engineering success. A teacher could better design their first few periods of revision if they had access to the standard-specific grades from the previous course.
Report Card Comments
At the secondary level, report card comments are largely a waste of time and resources. Students, parents, and post-secondary institutions only care about grades. Parents and students never ask the teachers about what they wrote about in the comments. It’s in part because of the cookie-cutter nature of the comments. Teachers have to mention a student’s content-related strengths and areas of improvement. Standards-based grading would remove the need for report card comments as the same information is quantitatively communicated. Better report cards, automated parent communication through tools like Google Classroom, periodic emails by the teacher, and parent-teacher meetings should provide ample information to the parents.
I can’t think of an educational practice with a worse return on investment than report card comments. Teachers have to write roughly 300 words for roughly 70 students four times per academic year. This results in 84000 words per year which is the equivalent of writing a novel per year (a rather boring and useless novel). Things get worse, principals then have to reread these comments and teachers have to adopt the suggestions. This is a tremendous waste of time and contributes to teacher burnout. With the advent of AI and better standards-based data, the province could automate the process if they insist on the need for qualitative information in the report cards.
Moving Forward
Grading is not merely a pedagogical tool; it is a force that shapes opportunities, aspirations, and trajectories. To act without rigour or structure in grading is to engage in ethical negligence.
Moving forward, we must acknowledge the immense responsibility grading carries. Professional judgment, rooted in evidence and shared practices, must stand as the final guardian against bias and inconsistency. This means implementing practices with proven predictive validity—grading systems that genuinely reflect students’ abilities and potential outcomes, not just their performance on a single assessment.
Let’s commit to a vision of grading that is both humane and scientifically sound, paving the way for a future where assessment fosters growth and equity.
Resources
- Growing Success
- PED-20 CECCE
- Assigning a Valid and Reliable Grade in a Course – Thomas M. Haladyna
- Assessment & Evaluation in the OCDSB
- Ahead of the Curve
- Ken O’Connor
- Thomas Guskey
- Marzano Scale
- Constructing Proficiency Scales – Chris Hunter
- Matt Townsley
- An Introduction to Psychometrics and Psychological Assessment – Colin Cooper
- Better Measurement with Item Response Theory – Ben Stenhaug
- How To Think About Teaching
- How To Teach

