Settlers of Catan is a must if you love playing strategic board games. We try to squeeze in games with friends whenever we can but most of our Cataning is done when we visit home over the holidays. This year, we decided to keep score (see spreadsheet) and track how many points each of us finished the game with. A small skill edge takes a large sample size to reveal itself.
After 26 games, we were all close in the number of wins given similar skill levels. The fact that the length of a game is typically around 45 minutes doesn’t help to grow this sample size. Analyzing data from the thousands of games being played online would be ideal.

After losing a few games in a row, I decided to see if someone had attempted to quantify the game of Catan. I found this dataset on Kaggle. The dataset is far from complete but I figured it would be a good starting point to distill some data-driven strategies given my background in statistics. It contains 50 four-player games which results in 200 rows of data. It is important to note that the four rows within a game are not independent since Catan is a game of finite resources.
TLDR
- Placing second in the four-player game sample resulted in the most wins.
- The average game had 64 rolls (sd = 13). That’s 16 turns each. Balance patience and making each turn count.
- Starting the game with settlements on tiles with more dots increases your chance of winning. Duh.
- You need 4 or five distinct resources to start the game. Wheat is king. Sheep probably help. Ditch lumber or clay if needed.
- Luck plays a big role in Catan. It is possible to win without picking up many cards but then you need another kind of luck.
- Many strategies lead to more victory points but not necessarily more wins.
- Cities and development cards are the way to go to win games. You need at least some roads and settlements to get there.
- More data is required to provide more detailed and valid prescriptions for strategy.
Starting Position
| Placement Order | 1 | 2 | 3 | 4 |
| Win Percentage | 16% | 36% | 28% | 20% |
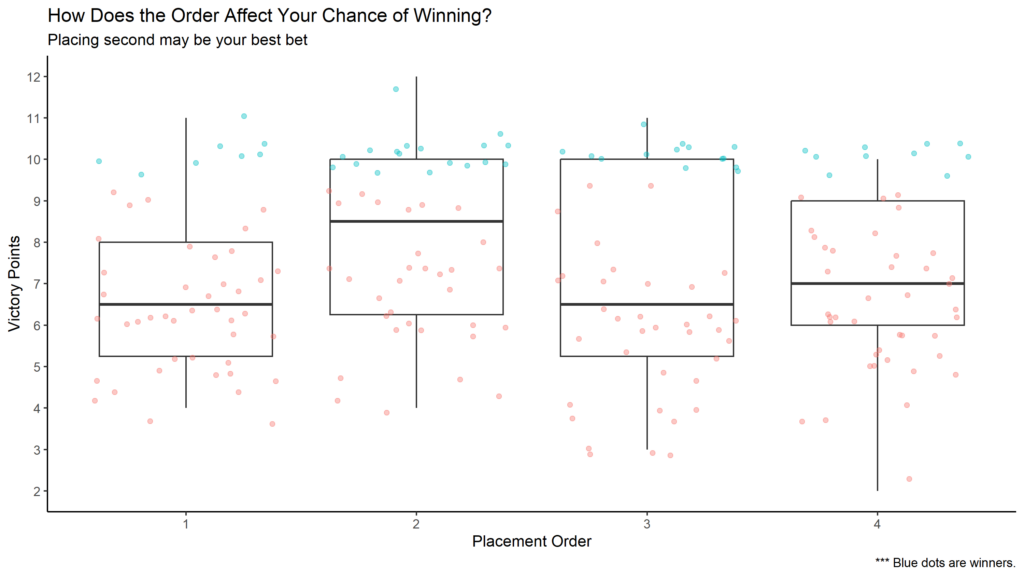
In this relatively small dataset of 50 four-player games, placing second resulted in the best chance of winning. It would be interesting to see if this result holds up with a larger sample size or for three-player games.
Rolls Distribution

The average four-player game in the sample had about 64 rolls. The distribution is roughly normal with a standard deviation of 13 rolls. Dividing 64 by 4 means that each player got an average of 16 turns to buy resources and build. This isn’t a lot considering that the first few turns are likely limited in the range of possible actions. A player has to make roughly 10 big decisions in a typical game.
Maximize Dots (But not at all cost)
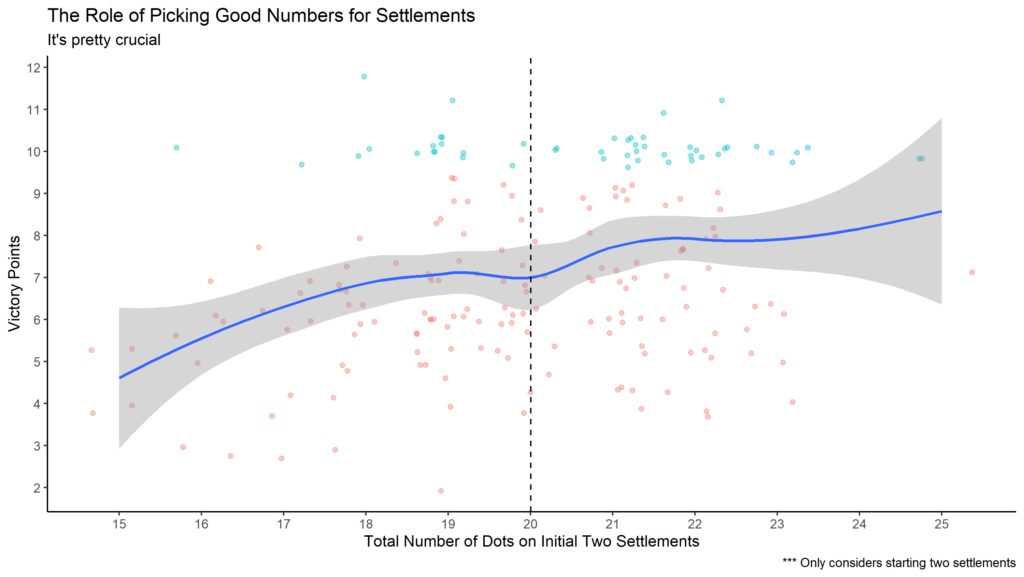
Unsurprisingly, placing your initial two settlements on tiles with many dots (high probabilities) increases your chance of winning. The average number of starting dots was 20. I don’t have the data to support this opinion but I believe that diversifying your resources at the expense of one or two dots is worth it. This is especially true for a resource like wheat which is needed to buy settlements, cities and development cards.
Here’s another way to visualize the data.

Starting Resources
Should you go for all five resources from the get-go? The data says that starting with four versus five resources results in a similar win percentage. Having 3 or fewer resources is a tough start to the game, however.

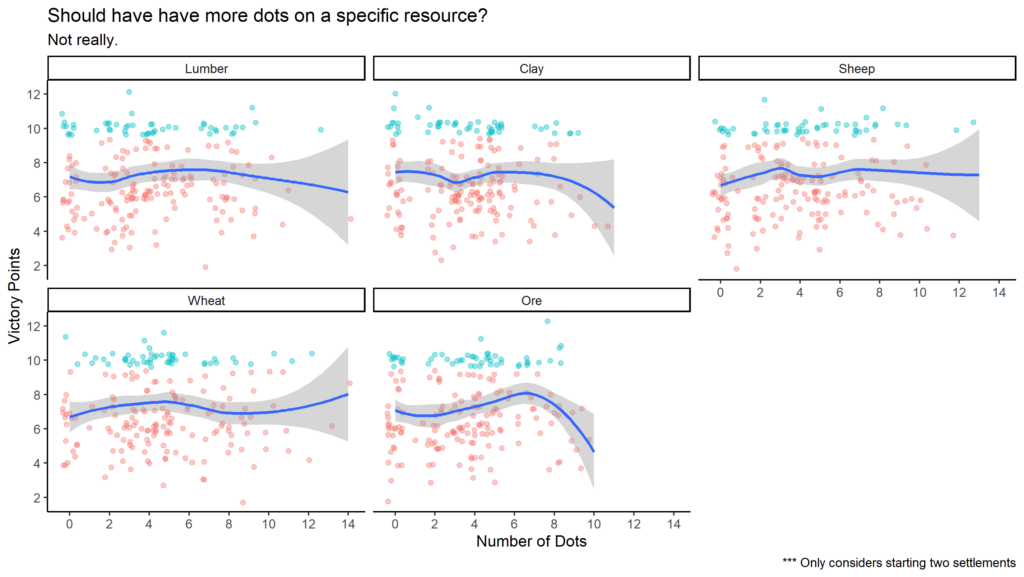
Knowing that starting with four out of the five resources doesn’t significantly decrease our chance to win, is there a resource that we should prioritize with starting settlements? The only resource with a large difference in win percentage is wheat. The players who started without wheat won less than 10% of their games (compared to the expected 25%). Starting without sheep may also put you at a disadvantage while lumber and clay seem to be the resources to ditch when in doubt.

If starting with wheat is crucial, does that mean that we should maximize the number of dots on these resources? No, not really. The plot below shows that we shouldn’t put all our eggs in one basket and diversifying our dots is a good idea. Your game will be more resilient to the robber.
Quantifying Luck
Like all great games, Catan is a mixture of skill and luck. Is it possible to win at Catan while being unlucky? Yes, but it sure is unlikely. You need to pick up at least some cards in order to apply your skill, strategize and make appealing trades to others. There are many types of luck in Catan and it can be challenging to quantify it.
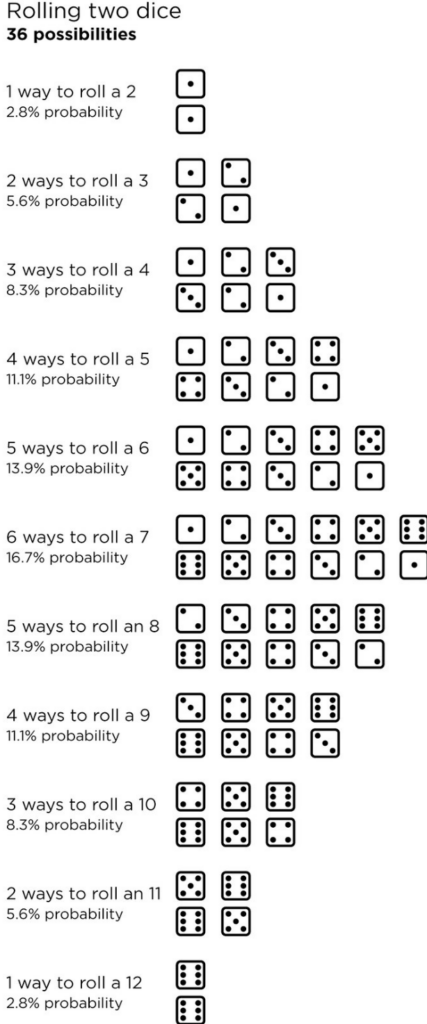
The dataset had information on the resources and numbers of the initial two settlements. It also had the final distribution of the rolls for each game. That said, it is possible to verify if the numbers on the initial tiles rolled more often than expected. For example, there are 5 ways out of 36 permutations to roll a 6 with two dice. In a game with 72 rolls, the six should roll an average of 10 times or 13.9% of the time. Thus, we can multiply this probability by the number of rolls to obtain the expected number of times this number should come out and compare it to the number of times It did come out in the game. If the number came out more than expected, then we can say the player got lucky.

Luck was normally distributed with most players hovering around the zero dashed line. This means that most of the time players pick up roughly the number of cards they could expect from the dots on their initial placements. Looking at the graph above, we can divide the number of cards picked up above expectation in the following intervals to paint a clearer picture.
| Interval | # of Winners | # of Games | Win % | |
| Very Unlucky | Less than -8 | 2 | 13 | 15.4% |
| Unlucky | Between -8 and -3 | 5 | 35 | 14.3% |
| Average Luck | Between -3 and 3 | 27 | 102 | 26.5% |
| Lucky | Between 3 and 8 | 15 | 40 | 37.5% |
| Very Lucky | More than 8 | 1 | 10 | 10% |
It’s clear from the table and graph above that luck plays a big role in winning at Catan. The luck metric only considers the initial two settlements and would likely be even more predictive if it took into account all settlements and cities. In this sample, 34 of the 50 winners (68%) had average or above-average luck on their initial settlements. It is possible to win while being unlucky, but I guess then you’d be lucky for finding a way to win while being unlucky.
Resources Picked Up
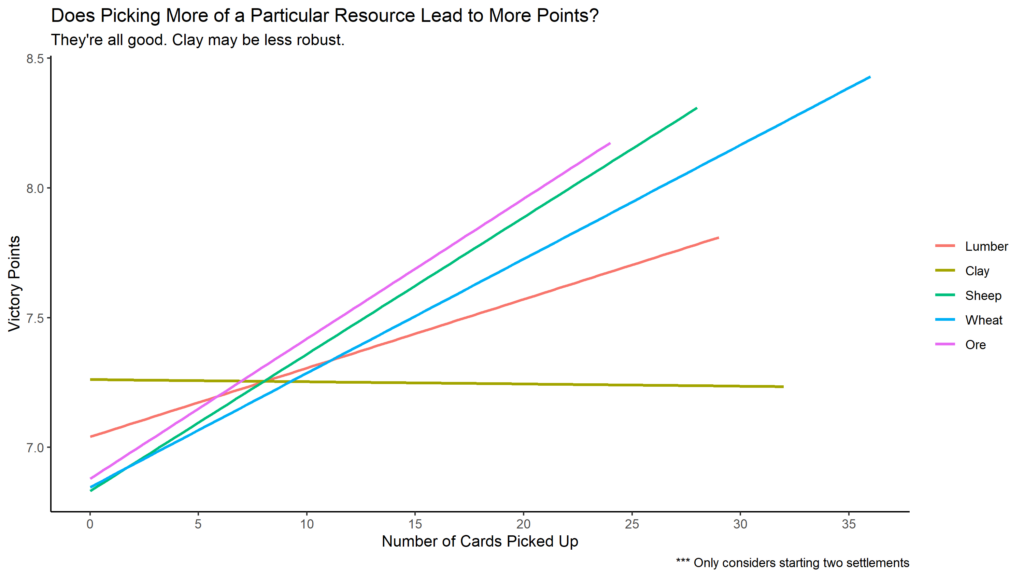
It’s not surprising that picking more of each resource correlated with more victory points. Clay was the only resource that didn’t. This makes sense since clay is only useful early in games to build roads and settlements. If this is the case, then why wouldn’t lumber behave similarly?

Looking at victory points and win percentage is not the same thing. Lumber and clay are not correlated to extra wins. Cities and development cards are the way to go to win games. But you need roads and settlements to get there. It’s a delicate balance.
The Big Picture
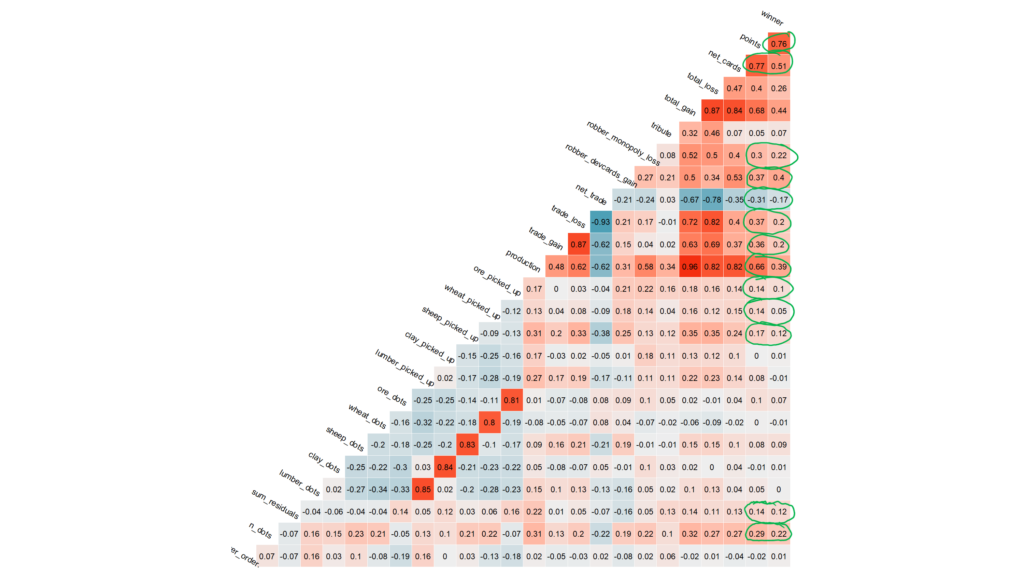
Nearly all metrics correlate more with victory points than wins. It would interesting to see how an AI system plays when strictly optimizing for win percentage instead of victory points. Humans tend to go for victory points and hope that a win comes along at the end. Alpha go came up with novel bizarre strategies for this reason.
Read This Next
- The Biometrics of High School Teaching
- Life Score: A Subjectively Objective Way to Evaluate your Life
- What I Learned from Tracking my Mood for 1000 days
- The Relation between Phone Usage and Mood
- Automate Your Finances
- My 10-day Vipassana Silent Retreat Experience
- Cal Newport Was Wrong
- Atomic Habits Book Review
- How Emotions Are Made – Book Notes