 Measuring Up: What Educational Testing Really Tells Us by Daniel Koretz
My rating: 4 of 5 stars
Solid book on the theory behind assessments. Great-read for psychometricians, teachers, and policymakers.
View all my reviews
TLDR – Main Takeaways
- What is the purpose of summative assessment in K-12 education?
- For teachers’ assessments, it’s to summarize and provide a shared meaning of the learning that has occurred relative to the curriculum standards. These grades can help teachers reteach some topics, they can help students practice certain skills before the final exam, and they can help administrators see which courses or subjects students struggle with the most.
- For standardized assessments, their purpose is to provide a system-level view. Teachers’ assessments differ from class to class and thus result in grades that can’t be compared straightforwardly. Standardized tests can also act as a validation metric for teacher grades. Students who do well in the course should do well on the standardized test.
- What is a valid test?
- According to the author, this is a nonsensical question. Tests themselves can’t be valid or invalid. The inferences made from test results can be valid or invalid.
- An assessment is only a tiny sample of the entire domain of potential questions a teacher could ask. For our inferences to be valid, the sample needs to be representative of the entire population of questions that could be asked.
- Broad and random sampling of the domain prevents teachers from “teaching to the test” because to do so, they need to teach the entire domain, which is a good thing.
- Curriculum standards are far from clearly defined domains. A standardized question bank or a textbook is a great way to operationalize the vague construct of C1. “demonstrate an understanding of the development and use of algebraic concepts and of their connection to numbers, using various tools and representations”. This standard could mean basic algebra we teach to 6-year-olds or PhD-level math. Item development is the only way to operationalize standards.
- Below are a few quotes from the author to illustrate this point:
- “In public debate, and sometimes in statutes and regulations as well, we find reference to “valid tests,” but tests themselves are not valid or invalid. Rather, it is an inference based on test scores that is valid or not. A given test might provide good support for one inference but weak support for another.”
- “Validity is also a continuum: inferences are rarely perfectly valid. The question to ask is how well supported the conclusion is.”
- “Validity is a continuum, one end of which is anchored by inferences that simply are not justified. At the other end of the spectrum, however, we are rarely fortunate enough to be able to walk away from the table having decided that an inference is valid, pure and simple. Rather, some inferences are better supported than others, but because the evidence bearing on this point is usually limited, we have to hedge our bets.”
- “Reliability is necessary but not sufficient for validity. Or, to put this differently, one can have a reliable measure without validity, but one cannot have a valid inference without reliability.”
- “In theory, a student could know no words at all other than the forty and still get a perfect score. In principle, one could teach the forty words, and nothing else, to Koko the gorilla (albeit in sign language), and she could then demonstrate a strong vocabulary on the test.”
- “…teaching students the specific content of the test, or material close enough to it to undermine the representativeness of the test—illustrates the contentious issue of score inflation, which refers to increases in scores that do not signal a commensurate increase in proficiency in the domain of interest.”
- “Discriminating items are simply needed if one wants to draw inferences about relative proficiency. This was clear in the vocabulary example: you chose discriminating items in order to be able to gauge the relative vocabularies of applicants. You did not create differences in vocabulary among your applicants by making this choice; you simply made it possible for the test to reveal the differences that already existed.”
- Are norm-referenced tests evil?
- “How do we know whether a high-school student who runs a mile in a bit over four minutes is a star? Norms again.”
- ““Norm-reference testing, which a lot of us in the audience grew up on, create[s] winners and losers. You got the top decile, you got your bottom decile, you got your average and above-average. They are designed to designate winners and losers.” This is one of the most fundamental misconceptions in the current debate about testing. Tests may “designate” winners and losers, but they don’t create them. There simply are winners and losers. Anywhere you look in the world, even in much more equitable societies, there is enormous variation in how well students perform. … If you choose not to measure that variation then you won’t see it, but it is there regardless.”
- See Daisy Christodoulou’s ResearchEd 2016 talk about comparative judgment.
- In theory, criterion-referenced assessment is better than norm-referenced assessment (Growing Success). If all students get the concept, it doesn’t make sense to report percentiles and punish students below the average. In this scenario, all students should get a level 4, indicating that the achievement “surpasses the provincial standard. The student demonstrates the specified knowledge and skills with a high degree of effectiveness. However, achievement at level 4 does not mean that the student has achieved expectations beyond those specified for the grade/course.” This is great in theory, but in practice, it’s difficult to clearly differentiate between a level 3 and a level 4. What grade should you give to a student who makes a few mistakes on the hard questions? What grade should you give to a student who gets all the questions right, but the questions were very basic?
- “Normative data often creep into standard setting. Sometimes this happens during the initial standard-setting process, as when panelists are given impact data. Sometimes it happens after the fact, when policymakers decide that the process has resulted in unreasonable or unacceptable standards. This modest reliance on normative data notwithstanding, standards are sometimes set at levels that normative data suggest are unreasonable.”
- “Parents of students achieving at level 3 can be confident that their children will be prepared for work in subsequent grades/courses.” (Growing Success) One way to validate standards is that very few students who get a level 3 or above in grade 9 should struggle in grade 10. This is called predictive validity.
- The only decision required from grades in K-12 education is whether the student obtains the credit. In Ontario, a “credit is granted and recorded for every course in which the student’s final percentage mark is 50 per cent or higher.” Thus, grades could be reported as a scaled-score (0 to 100) and the only standard required is a binary decision of pass or fail.
- How should we assess students with special needs?
- “…bias is an attribute of a specific inference, not of a test.”
- “Even though accommodations are a deliberate violation of standardization, they share its primary goal: to improve the validity of conclusions based on test scores.”
- “Now suppose they wanted to answer a third question: whether I was at that time, and with the proficiency I had then, likely to be successful in Hebrew-language university study. In that case, my low score would have been right on the money: I would have been a weak student indeed. … How they should best be tested—whether translations should be used, whether accommodations should be offered, and so on—depends on the inferences the scores will be used to support. And we must be much more specific about the intended inferences than we often are. It is not enough to refer to “mathematics proficiency” or “readiness for university study.””
- “…the impediment this student faced, her lack of visual acuity, was unrelated to the content and skills the test was designed to measure. In the ugly jargon of the trade, she faced “construct-irrelevant” barriers to performing well on the test. Therefore, the effects of the disability on her performance on the standard test were clearly bias: if given the exam in standard form, her score would imply a lower level of mastery than she had actually attained. If we could find an accommodation that would do nothing but offset this impediment, validity would be increased.”
- “For example, there was no reason to expect that lowering the lights or increasing the type size would have given her any unfair advantage.”
- “Additional time is the most common accommodation offered in systems that administer tests with time limits. But how much time should be allowed? Offering too much additional time may run the risk of overcompensating—creating an unfair advantage—rather than merely leveling the playing field.”
- “His dyslexia impedes his ability to read the test well, but his reading proficiency is precisely what we are trying to gauge by testing him.”
Book Notes
Chapter 1: If Only It Were So Simple
- “…tests are generally very small samples of behavior that we use to make estimates of students’ mastery of very large domains of knowledge and skill.“
- “A test score is just one indicator of what a student has learned—an exceptionally useful one in many ways, but nonetheless one that is unavoidably incomplete and somewhat error prone.”
- “Most of us grew up in a school system with some simple but arbitrary rules for grading tests, such as “90 percent correct gets you an A.” But replace a few hard questions with easier ones, or vice versa—and variations of this sort occur even when people try to avoid them—and “90 percent correct” no longer signifies the level of mastery it did before.”
- “To his evident annoyance, I responded that this would not be a sensible undertaking because there is no optimal design. Rather, designing a testing program is an exercise in trade-offs and compromise, and a judgment about which compromise is best will depend on specifics, such as the particular uses to which scores will be put. For example, the assessment designs that are best for providing descriptive information about the performance of groups (such as schools, districts, states, or even entire nations) are not suitable for systems in which the performance of individual students must be compared. Adding large, complex, demanding tasks to an assessment may extend the range of skills you can assess, but at the cost of making information about individual students less trustworthy.”
- “This proclivity to associate the arcane with the unimportant is both ludicrous and pernicious.”
Chapter 2: What Is a Test?
- “…if we want to measure the mathematics proficiency of eighth-graders, we need to specify what knowledge and skills we mean by “eighth-grade mathematics.” We might decide that this subsumes skills in arithmetic, measurement, plane geometry, basic algebra, and data analysis and statistics, but then we would have to decide which aspects of algebra and plane geometry matter and how much weight should be given to each component. Do students need to know the quadratic formula? Eventually, we end up with a detailed map of what the test should include, often called “test specifications” or a “test blueprint,” and the developer writes test items that sample from…”
- “And it has also resulted in uncountable instances of bad test preparation by teachers and others, in which instruction is focused on the small sample actually tested rather than the broader set of skills the mastery of which the test is supposed to signal.”
- “Specifically, it means only that all examinees face the same tasks, administered in the same manner and scored in the same way. The motivation for standardization is simple: to avoid irrelevant factors that might distort comparisons among individuals.”
- “…the test would be too hard for them. Everyone would receive a score of zero or nearly zero, and that would make the test useless: you would gain no useful information about the relative strengths of their vocabularies. List B is no better. The odds are high that all of your applicants would know the definitions of bath, travel, and carpet. Everyone would obtain a perfect or nearly perfect score. Once again, you would learn nothing, in this case because the test would be too easy. FIG. 2.1. Three words from each of three hypothetical word lists.”
- “Items and tests that discriminate are simply those that differentiate between students with more of whatever knowledge and skills one wants to measure and those with less. In this case, you want items that are more likely to be answered correctly by students with stronger vocabularies. Items that are too hard or too easy can’t discriminate—virtually…”
- “Discriminating items are simply needed if one wants to draw inferences about relative proficiency. This was clear in the vocabulary example: you chose discriminating items in order to be able to gauge the relative vocabularies of applicants. You did not create differences in vocabulary among your applicants by making this choice; you simply made it possible for the test to reveal the differences that already existed.”
- “The key is the particular inference the teacher wants to base on test scores. She would have no basis for an inference about relative proficiency if she used nondiscriminating items, but she would have a basis for an inference about mastery of that specific material.”
- “In public debate, and sometimes in statutes and regulations as well, we find reference to “valid tests,” but tests themselves are not valid or invalid. Rather, it is an inference based on test scores that is valid or not. A given test might provide good support for one inference but weak support for another. For example, a well-designed end-of-course exam in statistics might provide good support for inferences about students’ mastery of basic statistics but very weak support for conclusions about mastery of mathematics more broadly. Validity is also a continuum: inferences are rarely perfectly valid. The question to ask is how well supported the conclusion is.“
- “Inferences of this latter sort are called absolute inferences in the trade: you are comparing a student’s performance not to the performance of others but rather to an absolute standard.”
- “In theory, a student could know no words at all other than the forty and still get a perfect score. In principle, one could teach the forty words, and nothing else, to Koko the gorilla (albeit in sign language), and she could then demonstrate a strong vocabulary on the test.”
- “So as a rough estimate, their vocabularies would have increased by twenty words, from, say, 11,000 words to 11,020, or from 17,000 to 17,020. An improvement, perhaps, but hardly enough to merit comment. There may be cases in which learning what is specifically on the test constitutes substantial improvement, but the general conclusion remains that even inferences about improvement are undermined by certain types of test preparation that focus on the specific sample included in the test.”
- “…teaching students the specific content of the test, or material close enough to it to undermine the representativeness of the test—illustrates the contentious issue of score inflation, which refers to increases in scores that do not signal a commensurate increase in proficiency in the domain of interest.”
Chapter 3: What We Measure: Just How Good Is the Sample?
…it warns that it is inappropriate to use a score from a single test, without additional information, to assign students to special education, to hold students back, to screen students for first-time enrollment, to evaluate the effectiveness of an entire educational system, or to identify the “best” teachers or schools.2 And, again, this is not the position of anti-testing advocates; it is the advice of the authors of one of the best-known achievement tests in America.
- Good paper: Preliminary Considerations in Objective Test Construction — By E. F. Lindquist State University of Iowa (page 119)
- “The evidence shows unambiguously that standardized tests can measure a great deal that is of value, and clearly Lindquist believed this. But Lindquist was warning us that however valuable the information from an achievement test, it remains necessarily incomplete, and some of what it omits is very important.”
- ““The only perfectly valid measure of the attainment of an educational objective would be one based on direct observation of the natural behavior of … individuals…. Direct measurement is that based on a sample from the natural, or criterion, behavior … for each individual.”3 … But this sort of measurement is clearly impractical, Lindquist maintained, for many reasons. The criterion is delayed, for one. We really can’t afford to wait a decade or two to find out whether this year’s eighth-graders can use algebra in their adult work. Even if we were to wait a decade or two, the criterion behaviors—in this case, applying algebra successfully when appropriate—are often infrequent. … First, he pointed out that naturally occurring samples of behavior are not comparable. For example, suppose that I used a bit of algebra this morning, while a friend of mine, who is the dean of a law school, did not. Does that indicate that I successfully acquired more of this set of dispositions and skills than the dean did? … Second, Lindquist noted that some criterion behaviors are complex, requiring a variety of skills and knowledge. In such cases, if a person performed poorly on one of these criterion behaviors, one would not know why.”
- “Lindquist would have argued that if you want to determine whether third-grade students can manage subtraction with carrying, you give them problems that require subtraction with carrying but that entail as few ancillary skills as possible. You would not embed that skill in complex text, because then a student might fail to solve the problem either for want of these arithmetic skills or because of poor reading, and it would be hard to know which. This principle is still reflected in the design of some tests, but in other cases, reformers and test developers have deliberately moved in the opposite direction, attempting to create test items that present complex, “authentic” tasks more similar to those students might encounter out of school. Both sides in this argument are both right and wrong: there are advantages and disadvantages to both ways of designing tests. This is one of the many cases in which the designing of tests entails compromises, trade-offs between competing goals.”
- “For example, we know that teachers’ grading is on average much more lenient in high-poverty schools than in low-poverty schools. By assembling information from several sources that have different strengths and weaknesses, we can obtain a more complete view of what students know and can do.”
- “Scores on a single test are now routinely used as if they were a comprehensive summary of what students know or what schools produce. It is ironic and unfortunate that as testing has become more central to American education, we have strayed ever farther from the astute advice given so long ago by one of the nation’s most important and effective proponents of standardized testing.”
Chapter 4: The Evolution of American Testing
How do we know whether a high-school student who runs a mile in a bit over four minutes is a star? Norms again.
Daniel Koretz – Measuring Up
- “In each case, we use norms to make sense of quantitative information that otherwise would be hard to interpret. Nonetheless, in many quarters, norm-referenced reporting of performance on tests has an undeservedly bad name.”
- “…norm-referenced reporting can be paired with other forms of reporting that directly compare performance with expectations, such as standards-based reporting (discussed below).”
- ““Norm-reference testing, which a lot of us in the audience grew up on, create[s] winners and losers. You got the top decile, you got your bottom decile, you got your average and above-average. They are designed to designate winners and losers.”3 This is one of the most fundamental misconceptions in the current debate about testing. Tests may “designate” winners and losers, but they don’t create them. There simply are winners and losers. Anywhere you look in the world, even in much more equitable societies, there is enormous variation in how well students perform. … If you choose not to measure that variation then you won’t see it, but it is there regardless.“
- “The shift from using tests for information to holding students or educators directly accountable for scores is beyond a doubt the single most important change in testing in the past half century.”
- “Studies have also begun to shed light on the factors—other than simple cheating—that cause score inflation, such as focusing instruction on material emphasized by the test at the expense of other important aspects of the curriculum; focusing on unimportant details of a particular test; and teaching test-taking tricks. Score inflation is a preoccupation of mine, both because I have been investigating this problem for more than fifteen years and because I think it is one of the most serious hurdles we need to surmount if we are to find more effective ways of using tests for accountability.”
- “At one conference of testing experts during those years, a prominent advocate of performance assessments presented a lecture in which she made precisely this argument. In such an extreme form, this is a silly position; while many real-world problems do not have single correct answers, innumerable ones do. … As the speaker was leaving the building after her presentation, she stopped and told me that she did not know which of the surrounding hotels was the Hilton, where she had a reservation. I pointed out that this was a question with a single correct answer, in response to which she left in a huff without letting me tell her which one it was.”
- “Research has shown that the format of the tasks presented to students does not always reliably predict which skills they will bring to bear, and students often fail to apply higher-order skills to the solution of tasks that would seem to call for them.”
- “In traditional achievement testing, tasks were designed to extract diagnostic information that would enable teachers to improve instruction, but there was no expectation that the tasks used in instruction should resemble those in the test. The phrase “tests worth teaching to” had another connotation as well: tests would be designed such that preparing students for them—teaching to the test—would not lead to score inflation. But this was a logical sleight of hand. There is no reason to expect that a test that is “worth teaching to” in the sense of measuring higher-order skills and the like would be immune to score inflation. And as I explain in Chapter 10, research has confirmed that this expectation was false: even the scores on tests that avoid the multiple-choice format can become severely inflated.”
- “In matrix-sampled testing, the test is broken into a number of different parts that comprise different tasks, and these are then distributed randomly within classrooms or schools. Thus the test is not standardized for comparing individual students, but it is standardized for purposes of comparing schools or states. Matrix sampling is now common; it is used, for example, in NAEP, TIMSS, and some state assessments. The significance of this seemingly arcane innovation is that it allows the testing of a broader range of knowledge and skills—a larger sample from the domain—within a given amount of testing time. Initially this approach was seen as advantageous simply because it offers richer information, but it offers an additional, critically important benefit when tests are used for accountability: it changes the incentives for students and teachers. The broader the test, the less incentive there is to narrow instruction inappropriately as a way of “gaming” the system and inflating scores. … A pure matrix-sampling design does not provide useful scores for individual students because students take different, and therefore not comparable, subtests. Hence the controversy. … one portion of the test is common to all students and is used to provide individual scores, while the remainder is matrix-sampled and contributes only to scores for schools.”
- “This innovation in scoring is now almost universally accepted, it has been incorporated into federal statute, and it is widely considered desirable because it focuses on expectations and is supposedly easy to understand. In fact, however, it exacts a very high, perhaps excessive, cost. The process of setting standards—deciding just how much students have to do to pass muster—is technically complex and has a scientific aura, but in fact the standards are quite arbitrary. The simplicity of this form of reporting is therefore more apparent than real, and most people do not really have a clear idea of what the standards actually mean. For this reason, one often finds norm-referenced reporting sneaking back in, for example to show how a school’s percentage “proficient” compares with that of other schools. Standards-based reporting provides a very coarse and in some cases severely distorted view of achievement, and it can create the undesirable incentive to focus most on the kids who are nearest the standard that counts, to the detriment of others.”
Chapter 5: What Test Scores Tell Us about American Kids
- “The SAT mathematics scale runs from 200 to 800, while the ACT mathematics scale runs from 1 to 36. What does this difference in scales indicate? Nothing at all. These scales are arbitrary, have no intrinsic significance, and are not comparable.”
- “Some insist that the bell curve is the malicious creation of psychometricians who want to create an appearance of differences among groups. Others associate it with the pernicious and unfounded view that differences in test scores between racial and ethnic groups are biologically determined. None of these associations is warranted. … However, when several common conditions are met—when tests assess broad domains, are constructed of items that have a reasonable range of difficulty, and are scaled using most of the currently common methods—scale scores often show a roughly normal distribution, with many students clustered near the average and progressively fewer as one goes both lower and higher. Exceptions are not rare, however. If a test is easy for the students taking it, the distribution will not be normal—it will be asymmetrical, with a tail of low scores but many students piled up near the maximum score. A test that is too hard for the students taking it will have scores skewed in the other direction, with the greatest concentration of scores at the low end and a thin tail extending into higher scores.”
- “If standardized scales are so handy, why are they never used to present test scores to the public? Because most lay people cannot abide fractional and, worse, negative scores. Imagine a parent receiving a report from her child’s school that said, “Your daughter received a score of 0.50, which put her well above average.” A standardized score of 0.50 is well above average—if scores follow the bell curve exactly, it represents a percentile rank of 69—but it certainly does not seem like it. It is easy to envision a worried parent responding that she does not quite understand how her child obtained a score of one-half and nonetheless ended up above average. Did half the class get no questions right? Or worse, imagine a report that said, “Your son’s score on our math test was –.25.” Less than zero? I’d hate to be that child at the dinner table the night that report went home. So in a great many cases, psychometricians start with a standardized scale—it is produced automatically by many current scaling methods—and then convert it to some other scale that they think will be more palatable, one with a larger standard deviation to avoid fractional scores and a high enough mean that no one gets a negative score.”
- “Just how big was the decline in scores that put our nation at risk? There is no single answer, but painting with a broad brush and considering many different sources of data, it would be fair to call the drop “moderately large.””
- “Such changes are called compositional effects—changes in performance arising from changes in the composition of the tested group. In general, if subgroups that are growing have substantially different average scores than those that constitute a decreasing share of the group, the result is a change in the overall average score stemming simply from these trends in composition.”
- “As college attendance became more common, the proportion of high-school graduates electing to take admissions tests rose, and many of those newly added to the rolls were lower-scoring students. This was studied in considerable detail by the College Entrance Examination Board in the 1970s, and the research showed clearly that a sizable share of the drop in SAT scores was the result of this compositional change. Had the characteristics of the test-taking group remained constant, the decline would have been much smaller.”
- “I focus here on mean differences because changes in the percentage of students reaching a standard are very hard to interpret; they conflate the performance difference between groups with the level at which the standard has been set.”
- “Not all racial and ethnic differences favor whites. On tests of mathematics and science, one often finds whites lagging behind Asian Americans.”
- “It is essential to keep in mind what these data do and do not tell us. They indicate only that the average differences between racial and ethnic groups are substantial. But these average differences, even when very large, tell us nothing about individual students. The variability within any of these racial or ethnic groups is very large, almost as large as in the student population as a whole. There are some black and Hispanic students who score very high relative to the distribution of white students, and there are Asian American students who score well below the white average. Also, these data describe the differences between groups but do not explain them. The simple existence of a group difference, even if very large and persistent, tells us nothing about the causes of these differences.”
- “The first complication is that the tests used for international comparisons are, like all others, small samples of content, and the decisions about the sampling of content and the format of its presentation matter. For example, what percentage of mathematics test items should be allocated to algebra? (The decision was approximately 25 percent on the TIMSS test and NAEP tests but only 11 percent on the PISA test.) What aspects of algebra should be emphasized, and how should they be presented? What formats should be used, and in what mix? TIMSS and NAEP are roughly two-thirds multiple-choice while PISA is one-third.”
- “Statements such as “the United States scored at the international average” do not mean much when the international average can move up or down depending on which countries elect to participate in a given assessment.”
- “Yet more surprising was the ordering of countries: by and large, the social and educational homogeneity of countries does not predict homogeneity of student performance. Some small and homogeneous countries—for example, Tunisia and Norway—do have relatively small standard deviations of scores, but many do not. For example, in all three TIMSS surveys, the standard deviation of scores in Japan and Korea—both countries that are socially more homogeneous than the U.S. and that have more homogeneous education systems through the eighth grade—was roughly similar to the U.S. standard deviation.”
Chapter 6: What Influences Test Scores, or How Not to Pick a School
Chapter 7: Error and Reliability: How Much We Don’t
- “If you were to take repeated measurements and the average of those repeated measures gradually approached the right answer, you would have measurement error. If the average of repeated measures stayed incorrect, even with a great many measurements, you would have bias.”
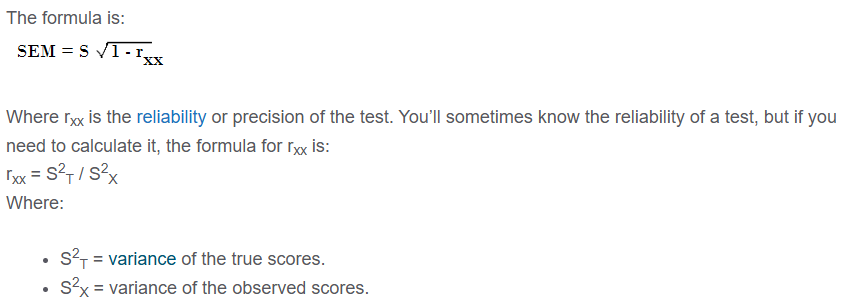
- “The technical reports accompanying most large-scale assessments usually include estimates of reliability, called internal consistency reliability statistics, that take into account only the measurement error that arises from the selection of items to construct that particular form of the test.”
- “This is the reason for the common but misguided advice that if you are trying to lose weight, you should weigh yourself only infrequently rather than daily. This is poor advice because if you compare only two measurements, say one week apart, the randomness of your scale’s behavior and the fluctuations in your own weight together will add error to both estimates and create a substantial risk that the comparison will be entirely misleading unless your weight change has been large enough to overwhelm these inconsistencies. A better, if compulsive, approach would be to take frequent measurements but to ignore differences from one time to the next, instead of taking averages or looking for underlying trends.”
- “(For this reason, all work in my classes is graded anonymously, with students identified solely by ID numbers, and students take their exams on computers to avoid issues raised by handwriting. We add names only at the end of the semester so that we can take other factors into account in assigning final grades, such as class participation and extenuating circumstances.)”
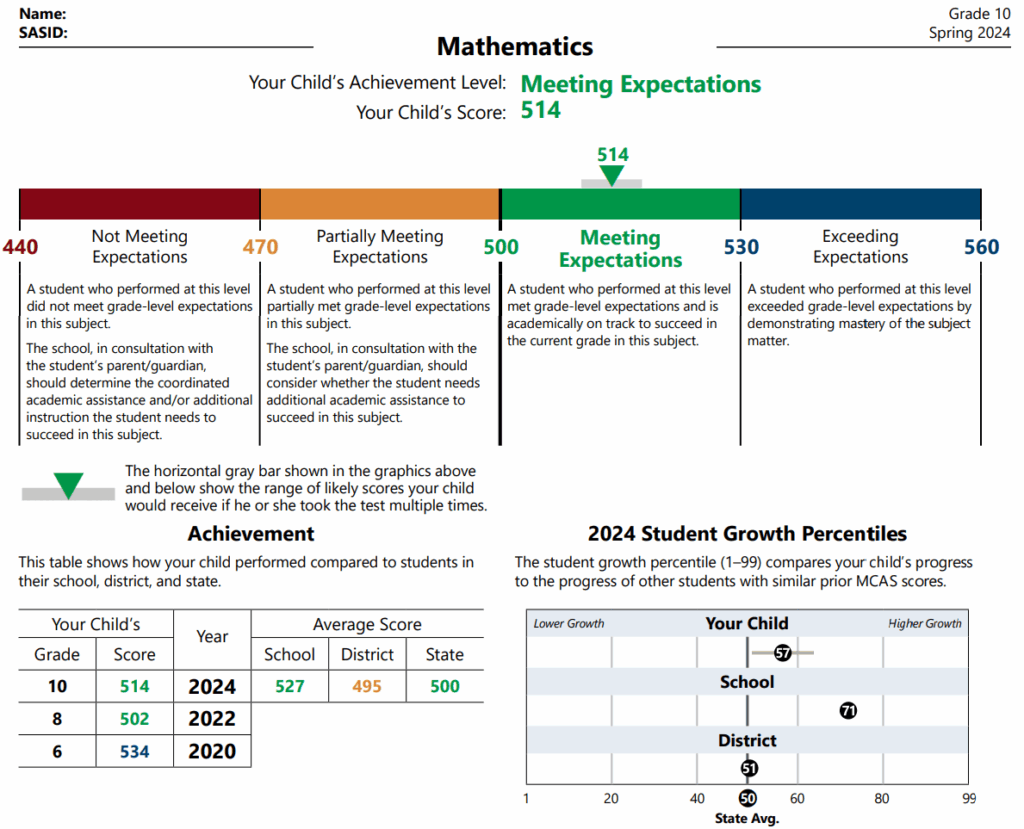
- “The dashed lines represent a distance of one standard error of measurement above or below the average. The range in this particular case is 66 points, 33 in each direction from the mean, which is similar to the standard error of measurement on the SAT. Roughly two-thirds of the simulated observations lie within that range. This is true in general: an examinee with any given true score, taking a test once, has a probability of about two-thirds of getting a score within the range from one SEM below that score to one SEM above, and a probability of one in three of obtaining a score more than one SEM away from the true score. Extending the range to two standard errors above and below the mean—in this case, from 484 to 616—would encompass about 95 percent of the scores our indefatigable examinee would obtain.”
- “However, if scores on the test were used as only one piece of information contributing to the decision to admit or reject students, a modest amount of measurement error would have little impact.”
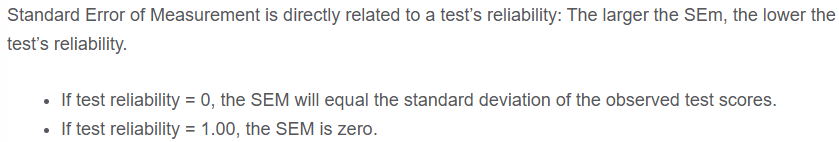
- “In large-scale assessment programs, the most reliable tests have reliability coefficients in the range of .90 or a bit higher.”
- “One is to ask, for a given reliability coefficient, how large is the band of error around an individual score? For example, even though the SAT is a highly reliable test, with a reliability coefficient over .90, the standard error of measurement is more than 30 points, similar to that shown in Figure 7.2. A reliability coefficient of .80 indicates an error band roughly 40 percent larger, and a reliability coefficient of .70 indicates an SEM almost 75 percent larger…”
Chapter 8: Reporting Performance: Standards and Scales
- “In their view, to label a student above average creates a false sense of success if the average itself is unacceptably low. And beyond that, the critics of norm-referenced reporting did not want value-neutral, purely descriptive reporting. They wanted to evaluate performance by comparing it with explicit goals.”
- “…content standards are statements of what students should know and be able to do, and performance standards indicate how much they should know and be able to do.”
- “…they almost always believe there is some underlying truth about performance, some real but hidden level of achievement that constitutes being “proficient,” that is somehow revealed by the complex methods used to set standards. Or, at the very least, that the standards set clearly break the continuum of performance into unambiguous categories.”
- “That is, they imagined students whose performance barely qualified as proficient. Then they had to estimate the probability that these imaginary, marginally proficient students would answer each item correctly.”
- “After the first round of ratings, the procedure used by NAEP and many other testing programs does introduce some actual data about performance, called impact data. Panelists are given the actual percentage of students who answered each item correctly—the percentage of all students, not the percentages of students in the imagined groups just above each of the standards, which have not yet been set. This adds a norm-referenced element to the standards because the impact data are in fact normative data about performance. NAEP also provides panelists with data about the variation in ratings among the panelists. With this additional information, the panelists rated the items a second time. They then were given another round of feedback and rated the items a third time.”
- “Another approach to standards setting that has rapidly grown in popularity—and is now the most common in state testing programs—is called the bookmark method. To start this process, the test publisher ranks all of the items on the test in terms of their actual difficulty. … They are then asked to go through the items in order of difficulty and to stop at the item that they believe would be answered correctly by a specified percentage of the marginally proficient students they have imagined. This percentage, called the response probability, is often set at 67 percent, but there is no compelling reason why it has to be, and panels have used a variety of response probabilities ranging at least from 50 percent to 80 percent.”
- “…in the case of these two common methods, estimates of the item-level performance of imagined groups of students—is not entirely confidence-inspiring. Whatever the pros and cons of these methods, they are not a means of uncovering some “true” or objective standard that is waiting to be discovered. This makes the resulting standards a lot less compelling than many people think they are, but it need not render them worthless by any means, and in fact there is a long-standing debate among measurement experts about their utility.”
- “In 1989, Richard Jaeger, then unquestionably one of the world’s leading experts on standard setting, published a comprehensive review in which he showed that the results of standard setting are generally inconsistent across methods. He reviewed thirty-two published comparisons and calculated the ratio of the percentages of students labeled as failing by different standard-setting methods. In the typical case (the median), the harsher method of standard setting categorized fully half again as many students as failing as did the more lenient method, and some studies found far larger ratios.7 More recent research has not provided any more grounds for optimism.”
- “Judges also have been found to underestimate the difficulty of hard items and overestimate the difficulty of easy items, which can lead them to set higher standards when the items they evaluate are more difficult.8 Changing the response probability used with the bookmark method—an arbitrary choice—can have dramatic effects on the placement of the standards.9…”
- “Performance standards are also often inconsistent across grades or among subjects within a grade.”
- “Even leaving aside all of these many inconsistencies, standards-based reporting has a serious drawback: it obscures a great deal of information about variations in student performance. This is a consequence not of the judgmental nature of standards but rather of the coarseness of the resulting scale. As described above, most standards-based systems have three or four performance standards that create four or five ranges or categories for reporting performance. Information about differences among students within any one of those ranges does not register. And those unnoted differences can be very large. As a result, substantial improvements can go unnoticed while trivially small gains can seem large.”
- ““Doesn’t this mean that the system is failing African American students and that they are falling farther behind?” To her evident annoyance, I told her that I had no idea and that I would need different data to answer her question. The problem, I explained to her, is that when performance is reported in terms of standards, comparisons of trends in performance between two groups that start out at different levels—such as whites and African Americans in Boston—are almost always misleading. There are two different statistics used for this purpose. One is the statistic she used: the composition of the group failing to (or succeeding in) reaching the standard. … The second statistic, far more common in reports of K–12 test scores, is the percentage of each group reaching (or failing to reach) a standard, such as the percentage of whites or African Americans reaching proficient. … Therefore, I told the audibly impatient reporter, the difference between groups that she gave me did not directly measure whether African Americans in Boston schools were falling farther behind whites. That might have been the case, but it was also possible that it was not. With the simple statistics that used to be routinely reported, such as mean scale scores, I could have told her. But differences among groups in terms of standards-based statistics, particularly changes in the percent exceeding the proficient standard, now dominate reporting of the achievement gap.”
- “Normative data often creep into standard setting. Sometimes this happens during the initial standard-setting process, as when panelists are given impact data. Sometimes it happens after the fact, when policymakers decide that the process has resulted in unreasonable or unacceptable standards. This modest reliance on normative data notwithstanding, standards are sometimes set at levels that normative data suggest are unreasonable.”
- “We can find out, for example, that in 2000, 22 percent of fourth-graders in Maryland reached or exceeded the proficient standard. Standards-based, right? But here is the rub: how do you know what to make of this result? Is 22 percent high or low? One way to find out is to compare this percentage to the percentages in other states. NAEP conveniently displays the percentages for all states together, ranked from highest to lowest. (Remember the panty hose chart in Chapter 7?) These charts report performance in terms of state norms—that is, by comparison to a distribution of the performance of states, expressed in terms of the percents above proficient. Thus, the NAEP reports rest on both standards and norms.”
- “For example, assume that you have to appoint a new coach for a middle-school track team. One applicant comes in brimming with enthusiasm and announces that his target is to have half of the distance runners clocking three-and-a-half-minute miles within a year. What do you do? You send him packing, because he is either utterly incompetent or a liar. … In other words, you rely on norm-referenced information to tell you that the level of performance he promises is absurd. This example is contrived, but the fact is that we use normative information constantly in all aspects of life—to evaluate the gas mileage of cars, to decide whether a purchase is too expensive, and so on. Testing is no different.”
- “Given all the problems that arise when student achievement is reported in terms of a few performance standards, what should be done? In a recent article in which he outlined a number of the most serious weaknesses of standards-based reporting, Robert Linn of the University of Colorado suggested that we distinguish the cases in which we do need to make binary, up-or-down decisions based on a test—for example, in setting a passing score on a written driving test or in using tests as a minimum criterion for professional licensure or certification—from those in which we do not need to do so. He suggested that in the latter instance, which includes most achievement testing in elementary and secondary schools, we would do better simply to avoid standards-based reporting.16 I agree, although, as Linn also noted, we are unlikely to have this option: standards-based reporting is likely to be with us for some time.”
- “This is the kind of test scoring we all grew up with, and it does have some utility. After every exam in my classes today, I present a graph showing the distribution of raw scores. This gives students some valuable norm-referenced information: a comparison of their performance with that of the rest of the class.”
- “Unfortunately, many of the scales used in educational testing are nonlinear transformations of each other. For the most part, the choice of scale does not affect rankings—students who score higher on one scale will score higher on another—but it does change comparisons. Two groups that show the same improvement over time on one of these scales may not show the same improvement on another.”
- “…the transformation from scale scores to PRs is not linear. On most tests, a lot of students are piled up with scores near the average, while far fewer have very high or very low scores.”
- “…for example, the SAT scale (within a subject area) runs from 200 to 800, while that of the ACT runs from 1 to 36. There is no substantive reason for this difference; no one would argue that a student who reaches the top score on the SAT knows twenty-two times as much as a student who reaches the maximum score on the ACT. And the ranking of college applicants would not be altered if ACT scoring were switched to match the SAT scale, or the College Board decided to change the SAT scoring to the ACT scale.”
- “In some respects, the arbitrariness of scale scores is less of a problem than that of performance standards. When performance standards are set, the levels expected of students are arbitrary, and the labels attached to them often carry additional, prior meaning, some of which may be unwarranted. Altering these decisions—selecting a different method that happens to move the standard up or down, or giving a standard a different verbal label—can have a major effect on the way people interpret student performance, even though the performance itself would not have changed. Scale scores lack this baggage. Few people read a report of a new testing program with some prior notion of what a score of 340 means.”
- “The NAEP is an interesting example because the agencies responsible for it have wrestled for years with the problem of adding meaning to scale scores and have devised quite a variety of approaches. One, of course, has been to layer performance standards (“achievement levels”) on top of the scale. But many of the approaches for giving the NAEP scores meaning rely on normative information. For example, normative data are key to making sense of NAEP’s much publicized comparisons among states. How is the commissioner of education in Minnesota to know whether that state’s mean scale score of 290 is good or bad? One way is to compare that average with the distribution of state averages, which the NAEP reports provide. The distribution shows that 290 is pretty damned good, at least so far as achievement in the United States is concerned. NAEP also provides, for every state, the proportion of students falling into each of the four performance “bins” created by the achievement levels—a combination of standards-based and norm-referenced reporting.17…”
- “The hoariest of these is grade equivalents, or GEs. These have fallen out of favor over the past several decades, which is a great shame, as they are quite easy to understand and provide an intuitively clear way to think about children’s development. A grade equivalent is simply the typical performance—the performance of the median student—at any grade level. It is usually shown in terms of academic years and months (with 10 academic months per school year). Thus a GE of 3.7 is the median performance of students in March of third grade on the test designed for third-graders. GEs tell you whether students are keeping pace with the norm group. Thus, if a third-grader obtains a GE of 4.7, that means that her performance on the third-grade test is well above average—specifically, it is comparable to that which the median student in March of fourth grade would show on the third-grade test.”
- “As useful as they are, GEs have a number of drawbacks. One is that the rate of growth in a subject area is not constant as children get older. For example, the typical child gains reading skills faster in the primary grades than later on. Therefore, a gain of one GE denotes greater growth in the early grades than in later grades. If you want to know, for example, whether the rate at which students learn math slows down or speeds up when they move to middle school, GEs by their very nature cannot tell you. The average student will gain one GE per year regardless.”
- “For example, suppose that one student showed a gain from 230 to 250 between third grade and fourth, and a second student increased from 245 to 265 between fourth grade and fifth. If these are developmental standard scores, their identical gains of 20 points would ideally mean that both improved their performance by the same amount. Despite the inconsistent and confusing labeling of these scales, you can often identify them by comparing the numbers across grades. If the numbers are similar across grades, the scale is not a developmental standard score, but if the numbers increase from grade to grade (and the scores are not on a grade-equivalent scale), the chances are good that it is one. In all fields, scales that have this property—that is, scales on which any given difference has the same meaning at different levels—are called interval scales.”
- “Just how much facility with basic multiplication is equivalent to a given gain in pre-algebra? A sensible rule of thumb is to treat these scales as approximate and to be increasingly skeptical as the grade range they cover grows larger.”
- “Technically, the problem is that test scores (like Fahrenheit temperature, but unlike length, speed, or any number of other common measures) are not a ratio scale, which means that zero on the test score scale does not mean “zero achievement.” Zero on most scales is just an arbitrary point. Even on a raw-score scale, where zero means zero items answered correctly, it need not mean “no knowledge of the domain”; it just means no mastery of the particular material on the test. Percentage change is a meaningful metric only in the case of ratio scales.”
Chapter 9: Validity
- “Validity is not a characteristic of the test itself. This may seem like splitting hairs, given that we are talking about conclusions that are themselves based on test scores, but it is anything but. One reason this distinction matters is that a given test score can be used to support a wide range of different conclusions, some of which may be justified and others not.”
- “Validity is a continuum, one end of which is anchored by inferences that simply are not justified. At the other end of the spectrum, however, we are rarely fortunate enough to be able to walk away from the table having decided that an inference is valid, pure and simple. Rather, some inferences are better supported than others, but because the evidence bearing on this point is usually limited, we have to hedge our bets.”
- “Until the 1980s and 1990s, direct assessments of writing, in which students actually write essays that are scored, were rare in statewide testing programs. Multiple-choice tests of language arts skills were common. Many critics argued, albeit usually without using the actual phrase, that this was a clear case of construct underrepresentation. Certainly, some skills needed for writing can be assessed with multiple-choice items. But some of the essential skills implied by the construct of “proficiency in writing” can be measured only by having students write. As a consequence, direct assessments of writing are now common.”
- “The converse of construct underrepresentation is measuring something unwanted. This goes by the yet uglier term construct-irrelevance variance.”
- “Or suppose that a test of mathematics or science contains some unnecessarily complex language. What will happen to the scores of nonnative speakers of English who have good mastery of mathematics or science but are thrown off by these irrelevant linguistic complexities?”
- “No test of a complex domain can be perfect. Some amount of construct underrepresentation and construct-irrelevant variance is inevitable, even in the case of a superb test. This is one reason that most inferences based on test scores cannot be perfectly valid. But often they are valid enough to be very useful. So how can one determine how valid an inference is? Many types of evidence can be brought to bear. In most discussions of the problem, one finds up to four different types of evidence: analysis of the content of the test, statistical analysis of performance on the test, statistical analysis of relationships between scores on the test and other variables, and the responses of students in taking the test. Reliability data, while often not presented as evidence bearing on validity, is also relevant. No one of these types of evidence alone is sufficient to establish that a conclusion is valid, although a single one may be the kiss of death in showing that an inference is not valid.”
- “Reliability is necessary but not sufficient for validity. Or, to put this differently, one can have a reliable measure without validity, but one cannot have a valid inference without reliability.”
- “In this case also, your inference about your weight, if you measured yourself only once, would not be worth much, despite the lack of bias. That is, its validity would be low because you would often reach the wrong conclusion. You could get a valid inference from this unreliable scale by weighing yourself many times and taking an average, but that is only because the reliability of the average would be much higher than that of a single observation.”
- “Results from a casual examination of a test’s content are often labeled face validity, as in “it seems valid on its face,” but people in the business of testing do not consider this real evidence of validity.”
- “Reliance on face validity reached a high point during the wave of enthusiasm for performance assessment, when many reformers and educators assumed that complex tasks necessarily tap higher-order skills better than multiple-choice items do. People were looking for rich, realistic, and engaging tasks to include in tests, so perhaps it was only natural that the tasks themselves, rather than other forms of evidence that I will describe momentarily, became the sine quo non of validity for many people who did not know better. In response, Bill Mehrens, now professor emeritus at Michigan State University, coined the term “faith validity.” And research confirmed that reliance on these types of test items was indeed a matter of faith: the format of test items does not always reliably predict the types of skills students will apply in tackling them.5…”
- “Grading tends to be much harsher in mathematics and the physical sciences than in the humanities.”
- “For example, scores on a new mathematics test ought to correlate more strongly with scores on another mathematics test than with scores on a reading test. Strong correlations between theoretically related measures are called convergent evidence of validity; weaker correlations between theoretically unrelated measures are discriminant evidence. … This is critically important—and it also makes this form of evidence difficult to evaluate—because students who do well in one subject tend to do well in another. As a result, even scores on subjects that we would consider unrelated usually show high correlations with one another.”
- “In the same ITBS data, schools’ average scores in reading correlated 0.88 with their average scores in mathematics (Table 9.2), indicating that knowing schools’ average scores in one of these two subjects allows one to predict more than three-fourths of the variation in school means in the second subject. As a consequence, one typically finds only small differences in the correlations between related and unrelated subjects, which makes the use of this convergent and discriminant evidence difficult.”
- “Both states used portfolio assessments in writing and mathematics but also gave other, standardized tests. In Vermont, mathematics portfolio scores correlated about as strongly with a standardized test of writing as with a standardized test of math.6 In Kentucky, the portfolio assessment of mathematics correlated more strongly with the portfolio assessment of writing than with anything else.7 These findings suggest that the mathematics portfolio assessments were measuring things other than mathematics—proficiency in writing and differences among teachers in the way portfolio tasks were generated and revised.”
- “…a red flag goes up if members of different groups—say, boys and girls—who have the same score on the test as a whole show markedly different performance on some items. This is a sign of possible bias in those items, which would undermine the validity of inferences for one of the groups.”
- “…one expects that, on average, students with higher scores on the test as a whole will perform better on any individual test item than students with lower scores on the test as a whole. If this is not found, the individual item is measuring something different than the rest of the test.”
Chapter 10 Inflated Test Scores
- “Campbell’s law in social science: “The more any quantitative social indicator is used for social decision-making, the more subject it will be to corruption pressures and the more apt it will be to distort and corrupt the social processes it is intended to monitor.””
- ““An overwhelming majority of cardiologists in New York say that, in certain circumstances, they do not operate on patients who might benefit from heart surgery, because they are worried about hurting their rankings on physician scorecards issued by the state.”8 Fully 83 percent of respondents said that the reporting of mortality rates had this effect, and 79 percent admitted that “the knowledge that mortality statistics would be made public” had affected their own decisions about whether to perform surgery.”
- “Given the current high-stakes uses of tests, we can be confident of the validity of inferences about improvement only if we have an additional type of validity evidence: a comparison to a second measure less threatened by the possibility of corruption (often called an audit test). The logic of using an audit test is simple: if gains on the tested sample generalize to the domain, they should generalize to other, similar samples from the domain. In this case, the similar sample is the audit test.”
- “For example, some people use “teaching the test” to refer to teaching specific items on the test (clearly bad) and “teaching to the test” to refer to focusing on the skills the test is supposed to represent (presumably good). Others, however, use “teaching to the test” to mean instruction that is inappropriately focused on the details of the test (presumably bad, and likely to inflate scores). I think it’s best to ignore all of this and to distinguish instead between seven different types of test preparation:
- Working more effectively
- Teaching more
- Working harder
- Reallocation
- Alignment
- Coaching
- Cheating…”
- “For example, it is not clear that depriving young children of recess, which many schools are now doing in an effort to raise scores, is effective, and in my opinion it is undesirable regardless. Similarly, if students’ workload becomes excessive, it may interfere with learning. It may also generate an aversion to learning that could have serious repercussions later in life.”
- “And reallocation is not limited to teachers. For example, some studies have found that school administrators reassign teachers to place the most effective ones in the grades in which important tests are given.10…”
- “Coaching refers to focusing instruction on small details of the test, many of which have no substantive meaning. For example, if a test happens to use the multiple-choice format for testing certain content, one can teach students tricks that work with that format. One can teach students to write in ways that are tailored to the specific scoring rubrics used with a particular test. … Coaching need not inflate scores. If the format or content of a test is sufficiently unfamiliar, a modest amount of coaching may even increase the validity of scores. For example, the first time young students are given a test that requires filling in bubbles on an optical scanning sheet, it is worth spending a very short time familiarizing them with this procedure before they start the test. Most often, however, coaching either wastes time or inflates scores. Inflation occurs when coaching generates gains that are limited to a specific test—or to others that are very similar—and that do not generalize well to other tests of the same domain or to performance in real life. A good example is training students to use a process of elimination in answering multiple-choice questions—that is, eliminating incorrect answers rather than figuring out the correct one.”
Chapter 11: Adverse Impact and Bias
- “…bias is an attribute of a specific inference, not of a test.”
- “Similarly, a difference in scores between groups—between poor and rich kids, males and females, blacks and whites, Asian Americans and whites—does not necessarily indicate bias. Bias might contribute to the difference, or it might not. A difference in scores entails bias only if it is misleading (again, for a particular inference).”
- “It is well known that, on average, the schools serving poor children are of lower quality than those serving students from higher-income families. Resources are more limited in schools in low-income areas, for example, and teaching positions are more likely to be filled by inexperienced and uncertified teachers. Now let’s assume—hardly a risky assumption—that some of these differences among schools matter and that, as a result, many poor students learn less in school and end up less well prepared for college. If that is true, tests designed to estimate how well prepared students are for college should give lower average scores to students from these lower-quality schools, and hence, on average, to low-income children. A valid inference about preparedness for college would require that these students obtain lower scores.”
Thus a difference in scores between groups is a reason to check for bias but not grounds to assume it.
Daniel Koretz – Measuring Up
- “Adverse impact can arise without bias, and conversely, bias can exist even in the absence of any adverse impact.”
- “A common way of examining performance on individual test items goes by the cumbersome name of differential item functioning, or DIF. DIF refers to group differences in performance on a particular test item among students who are comparable in terms of their overall proficiency.”
- “But now suppose that we match boys and girls on their total scores. We ask: do girls and boys with the same test score perform differently on this item? Ideally, the answer would be no. A substantial difference in performance between matched boys and girls would constitute DIF.”
- “Therefore, DIF can arise from differences in instruction experienced by the average student in various ethnic groups. The same could hold true of social-class differences in performance. Gender differences are a another matter—boys and girls are similarly distributed across regions and, for the most part, schools—but at the high-school level, they may choose different courses, and that too may result in meaningful differences in performance that appear as DIF.”
- “To play it safe, test authors often discard items that show very large amounts of DIF, even if they cannot identify its cause. But apart from that, the benefit of DIF is that it allows us to zero in on specific test items that require more examination.”
- “…group differences in scores will appear smaller on unreliable tests than on reliable ones. As one colleague of mine quipped years ago, “The easiest way to shrink group differences in performance is to write lousy, unreliable tests.”*”
- “First, the fact that large score differences between social groups need not indicate bias does not imply that they never do. The appropriate response is to treat these score differences as a reason to check for bias.”
Chapter 12: Testing Students with Special Needs
Even though accommodations are a deliberate violation of standardization, they share its primary goal: to improve the validity of conclusions based on test scores.
Daniel Koretz – Measuring Up
- “Their more important argument is that the services delivered to a student should be based on each individual’s functional impediments to learning, not the broad classification into which the child’s disability places him. Two students classified as having different primary disabilities may need the same services, and two others with the same classification may require different services.”
- “But what happens to a student who has a visual disability and can read the test materials only very slowly and with great strain? Your estimate of proficiency for him will not only be fuzzy but will also be biased downward, lower than his actual proficiency warrants. If you tested him repeatedly, you could reduce the fuzziness but you would zero in on the wrong score. The ideal accommodations would function like a corrective lens, offsetting the disability-related impediments to performance and raising your estimate of the student’s proficiency to the level it should be. This would make the scores obtained by students with disabilities comparable in meaning to the scores obtained by other students.”
- “Thus the purpose of accommodations is not to help students score better but to help them score as well as their actual proficiency warrants, and not higher. In other words, their purpose is to improve validity, not to increase scores.”
- “…the impediment this student faced, her lack of visual acuity, was unrelated to the content and skills the test was designed to measure. In the ugly jargon of the trade, she faced “construct-irrelevant” barriers to performing well on the test. Therefore, the effects of the disability on her performance on the standard test were clearly bias: if given the exam in standard form, her score would imply a lower level of mastery than she had actually attained. If we could find an accommodation that would do nothing but offset this impediment, validity would be increased.”
- “For example, there was no reason to expect that lowering the lights or increasing the type size would have given her any unfair advantage.”
- It wouldn’t advantage other students to have large print
- “For example, a complex mathematics task might require that you return to the prompt repeatedly for numerical data or to extract information from a graphic. This takes additional time for students who read braille, this one student claimed, because they cannot skim quickly and must go over the entire item or a large part of it more slowly to re-locate the information. The student maintained that this places them at a disadvantage, particularly if they do not receive additional time.6…”
- “Aoccdrnig to a rscheearch at Cmabrigde Uinervtisy,it deosn’t mttaer in waht oredr the ltteers in a wrod are, the olny iprmoetnt tihng is taht the frist and lsat ltteer be at the rghit pclae. The rset can be a toatl mses and you can sitll raed it wouthit porbelm. Tihs is bcuseae the huamn mnid deos not raed ervey lteter by istlef, but the wrod as a wlohe.”
Additional time is the most common accommodation offered in systems that administer tests with time limits. But how much time should be allowed? Offering too much additional time may run the risk of overcompensating—creating an unfair advantage—rather than merely leveling the playing field.
Daniel Koretz – Measuring Up
- “His dyslexia impedes his ability to read the test well, but his reading proficiency is precisely what we are trying to gauge by testing him.”
- “Many contemporary tests of mathematics strive to include realistic problems of the sort that students would encounter outside of school. Many of these tests entail a good bit of reading; some also require that students write explanations of their answers.”
- “Clearly, the more reading and writing a math test requires, the more likely it is that the scores of dyslexic students will be adversely affected by their disabilities. But is this adverse effect a bias that should be offset by accommodations, or is it in fact a realistic indicator of lower proficiency? The answer, the NRC panel explained, is that it depends on the specific inference you base on the scores—that is, it depends on what you mean by “proficiency in mathematics.” On the one hand, if you were using scores to estimate skills such as computational facility, the performance of dyslexic students on math tests that require substantial reading clearly would be biased downward, because their difficulties in reading would make it hard for them to demonstrate their computational skills. On the other hand, if you were using scores to estimate how well students can apply such skills to real-world problems of the sort they may encounter later, including mathematics problems embedded in text, the scores would be less biased.”
- “…one group has the standard amount of time, another has half again as much, and a third group has twice as much time. We find that the first group gets the lowest scores and the third gets the highest. Which of the three sets of scores is the most accurate? With what would you compare them to find out? For most K–12 testing, we lack a trustworthy standard with which to compare them.”
- “Not all students with disabilities score poorly, of course, but overall, students with disabilities are disproportionately represented at the low end of the distribution.”
- “In practice, there is no single standard error. Rather, there are many: the margin of error for students for whom the test is appropriately difficult is smaller than those for higher- and lower-scoring students.”
- “The GRE is a computer-adaptive test (often abbreviated CAT), in which the performance of students on early items leads to their being assigned either easier or more difficult items to better match their performance level. The result is a higher level of reliability because students are not wasting time on items that are too easy or difficult for them.”
- “To expect mildly retarded students to outperform the entire bottom third of students in the highest-scoring countries in the world, and to expect this to happen in twelve years, no less, is remarkably naive. I have no doubt that the motivation for this mandate is good, an attempt to force schools to attend more to the achievement of students with disabilities. This stands in contrast to earlier federal requirements that focused primarily on procedural issues, such as the appropriate classroom placements for students. Nonetheless, as a former special education teacher, I consider the extremity of the requirements unfair to teachers and cruel to students, because it forces them to take tests on which they cannot be successful and to be labeled as failures even if they are working well relative to their capabilities.”
- “On the one hand, I and many others consider the current drive to improve the performance of low-scoring students essential and long overdue. This requires that higher standards be imposed for these students. At the same time, even if we were to succeed in this respect, we will still confront a very wide distribution of performance. The dilemma is to find a way to meet the goal of confronting unwanted variations in performance while still being realistic about the variations that will persist.”
- “Now suppose they wanted to answer a third question: whether I was at that time, and with the proficiency I had then, likely to be successful in Hebrew-language university study. In that case, my low score would have been right on the money: I would have been a weak student indeed. … How they should best be tested—whether translations should be used, whether accommodations should be offered, and so on—depends on the inferences the scores will be used to support. And we must be much more specific about the intended inferences than we often are. It is not enough to refer to “mathematics proficiency” or “readiness for university study.””
Chapter 13: Sensible Uses of Tests
- “The list of threats to the conclusions commonly based on test scores—threats to validity—is long. Some of the big ones: There is measurement error, to start, which creates a band of uncertainty around each student’s score. When we are concerned with aggregates, such as the average score or percent proficient in a school, there is sampling error as well, which causes meaningless fluctuations in scores from one group of students to another and from one year to the next. This is a particularly serious problem for small groups—for example, when tracking the performance of small schools or, even more problematic, the performance of groups of students within a school. The results we rely on are sometimes specific to a given test. Different choices of content, different methods of scoring, different item formats, even different mathematical methods for scaling a test can produce somewhat different patterns of scores. Different ways of reporting performance do not always paint the same picture. This is a particular concern in the light of the current reliance on standards-based reporting, which is one of the worst ways to report performance on tests and is sometimes simply misleading. Potential bias should always be a concern, especially when assessing certain groups of students, such as those with disabilities or limited proficiency in English. The current ubiquitous and intense pressure to raise scores creates the potential for seriously inflated scores.”
- “To start, the notion of an “international mean” is useless. The average can vary markedly from survey to survey, depending on the mix of nations participating in the survey.”
- “…don’t treat any single test as providing the “right,” authoritative answer. Ever. When possible, use more than one source of information about achievement—results from additional tests, or information from other sources entirely. With data from several sources—PISA, several iterations of TIMSS, and a few earlier international studies—we can see that there is little doubt: the United States always scores far below Japan, even though it does not always score above Norway.”
- “Rather than calling them below basic, basic, proficient, and advanced—labels that carry a lot of unwarranted freight—try thinking of them as four merely arbitrary levels of performance, say, level 1, level 2, level 3, and level 4. Proponents of standards-based reporting might say that this suggestion is over the top and that the standards are in some way tied to descriptions of what kids actually can do. There is some truth to that claim, but the uncomfortable fact is that the various methods used to set the performance standards can be strikingly inconsistent. … I think you are more likely to be misled by taking the descriptions of standards at face value than by treating the standards as arbitrary classifications.”
- “…one can safely assume neither that the schools with the largest score gains are in fact improving the most rapidly nor that those with the highest scores are the best. So how should you use scores to help you evaluate a school? Start by reminding yourself that scores describe some of what students can do, but they don’t describe all they can do, and they don’t explain why they can or cannot do it. Use scores as a starting point, and look for other evidence of school quality—ideally not just other aspects of student achievement but also the quality of instruction and other activities within the school.”
- “…are the differences in performance between different parts of the test sufficiently reliable that they can be used as a basis for changing instruction?”
- “Invariably, serving one master well means serving others more poorly. A test optimized to provide information about groups, for example, is not optimal for providing scores for individual students. That is why the National Assessment of Educational Progress cannot provide scores for individuals. A test that is constructed of a small number of large, complex tasks in an effort to assess students’ proficiency in solving complex problems will be poorly suited to identifying narrow, specific skills that the students have nor have not successfully mastered.”
- “To obtain valid and reliable information about what students are learning, we need to focus tests on their levels of performance and on the content that they are actually studying.”
- “The notion that we can figure out what “proficient” students should be able to do and then require schools to get them there has its appeal, but as previous chapters have showed, the way that this is now done can be a house of cards.”
- “And in setting goals, we need to recognize that wide variations in performance are a human universal, something that our educational system would have to address even if we had the political will and the means to reduce the glaring social inequities that plague our educational system and our society.”
- “I strongly support the goal of improved accountability in public education. I saw the need for it when I was myself an elementary school and junior high school teacher, many years ago. I certainly saw it as the parent of two children in school. Nothing in more than a quarter century of education research has led me to change my mind on this point. And it seems clear that student achievement must be one of the most important things for which educators and school systems should be accountable. However, we need an effective system of accountability, one that maximizes real gains and minimizes bogus gains and other negative side effects. We need a system analogous to an FDA-approved drug: both effective and safe. All that we have seen so far tells us that the simple test-based accountability systems we use now do not meet this standard. … There is no reason to expect test-based accountability education to be exempt from Campbell’s law, and the research evidence indicates that it is not.”
In all, educational testing is much like a powerful medication. If used carefully, it can be immensely informative, and it can be a very powerful tool for changing education for the better. Used indiscriminately, it poses a risk of various and severe side effects. Unlike powerful medications, however, tests are used with little independent oversight. Let the buyer beware.
Daniel Koretz – Measuring Up
Read This Next
- How To Think About Teaching
- How To Teach
- Ahead of the Curve — Book Summary
- ResearchED Toronto Takeaways 2024
- Chalk & Talk Podcast Notes – Anna Stokke
- The Life of a High School Teacher
- The Biometrics of High School Teaching
- Takeaways From Teaching High School Math For 2 Months
- The Tutor & The Gardener – My Teaching Philosophy
- How I Would Study for the Math Proficiency Test
- Millionaire Teacher – Book Notes