The unexamined life is not worth living.
Socrates
Am I getting happier over time? Is my mood getting more stable? These are questions we will attempt to answer in this article. I have tracked my mood on a scale of 1 to 5 (5 being the greatest) along with the activities I did that day using the Daylio app for a while now. I did not track all the activities every day but I figured that 1000 consecutive days of tracking my mood might reveal some insights. There are some days where I added more than one mood rating. Ideally, we would all have a continual happiness monitor (patent pending) that accurately measures our mood every few seconds. In spite of that, daily mood-tracking should reveal some higher-level patterns. Let’s explore the data to see what we are working with.
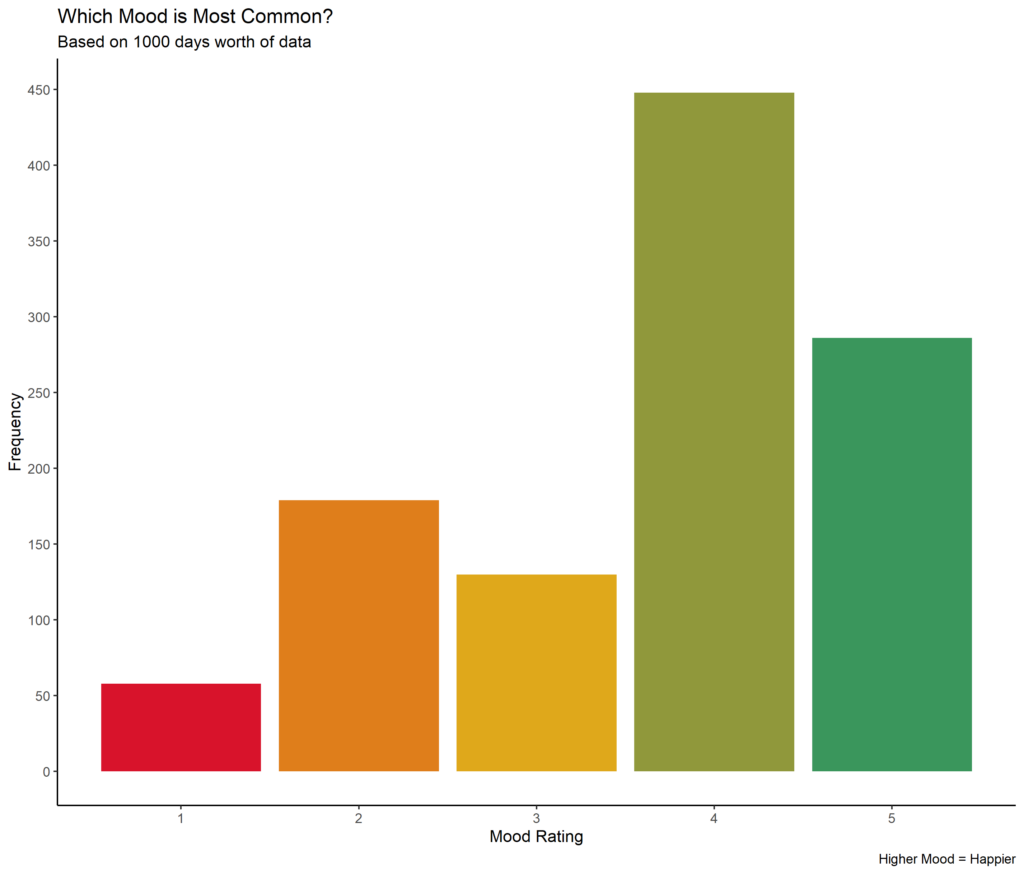
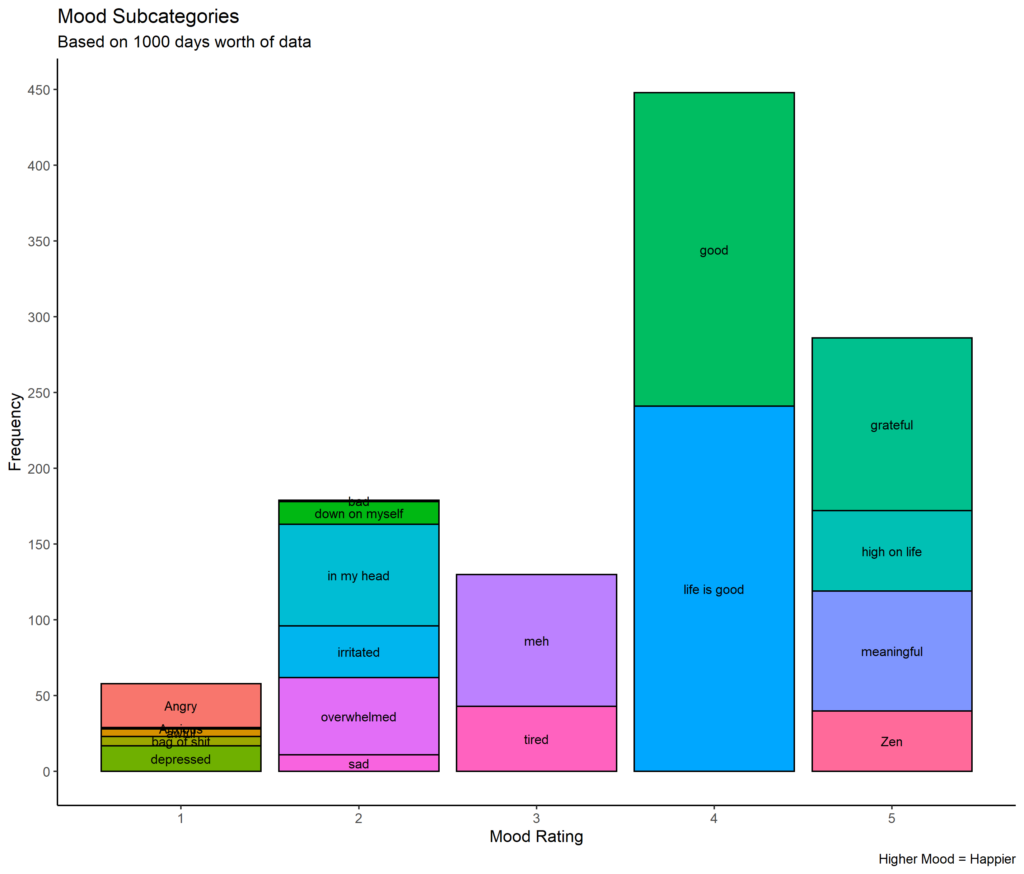
As you can see in Figure 1, I rate most days as a 4/5. The least common rating is 1/5. The mood’s distribution is skewed to the left meaning that bad days are less common than good days. This observation alone can be insightful. My guess is that the mood distribution is highly dependant on the person and may change across time for some. I know some folks who’ve been tracking their mood who report a right-skew in their mood. We can also look at Figure 2 below to see that my most popular subcategory is “life is good” at level 4.
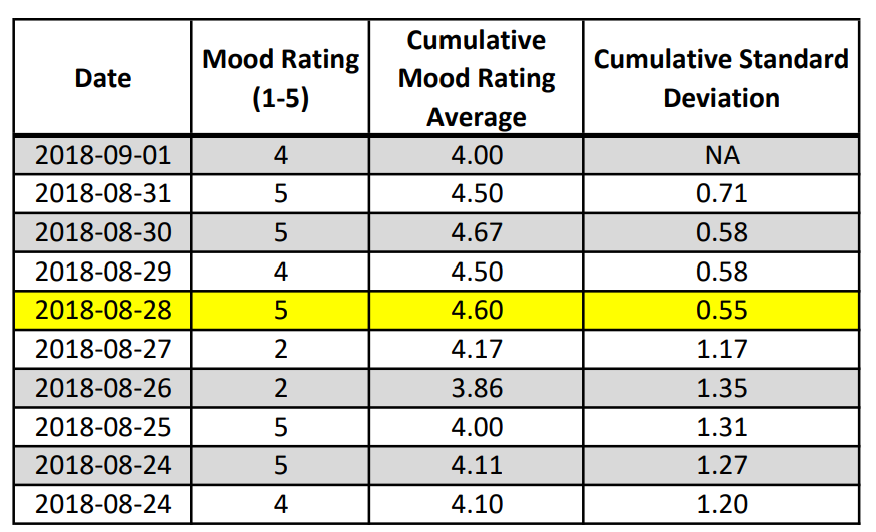
Now, let’s explore whether I am getting happier over time. We can look at the first 10 entries shown below (Table 1) to get a sense of how we can calculate the average mood. The cumulative average is simply the average of all the previous entries. Let’s take the fifth row as an example. The 4.6 cumulating mood rating comes from adding the first five ratings and dividing them by five.
![\[\frac{4+5+5+4+5}{5} = \frac{23}{5} = 4.6\]](https://duddhawork.com/wp-content/ql-cache/quicklatex.com-dd50f929463d25b246ba2739a7668de9_l3.png "Rendered by QuickLaTeX.com")
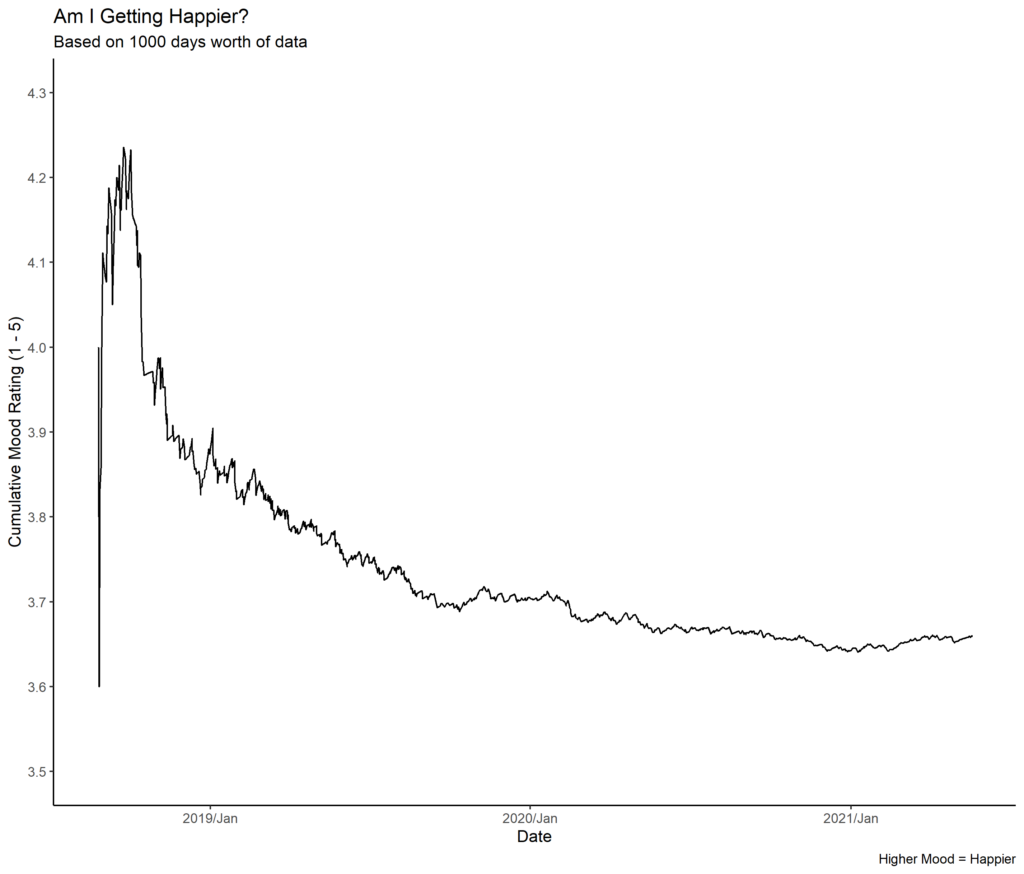
The graph below represents the cumulative average mood rating over a period of about three years. One might look at the early peak of Figure 3 and conclude that I was getting less happy until the average reaches about 3.7. I think a more likely explanation is that my average mood was always around 3.7 and that it took about a year to stabilize. A rating of 5/5 in the early days had a disproportionate effect since the sample size was much smaller. Knowing that my current baseline happiness is around 3.7/5 can be very useful moving forward.
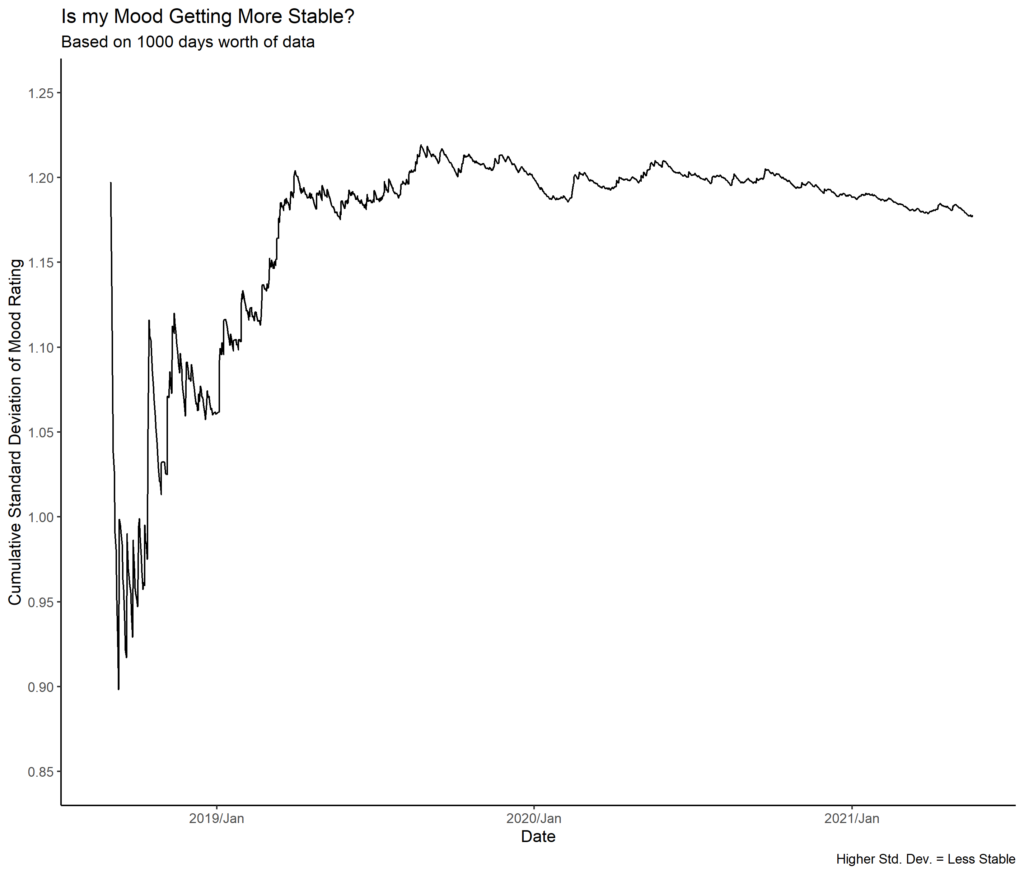
The next question we can tackle can be found in the title of Figure 4 below. Is my mood getting more stable? Standard deviation is a measure of how stable my mood is from day to day. A lower value indicates more stability. Again, it takes about a year for the variability to converge to a value of approximately 1.2.
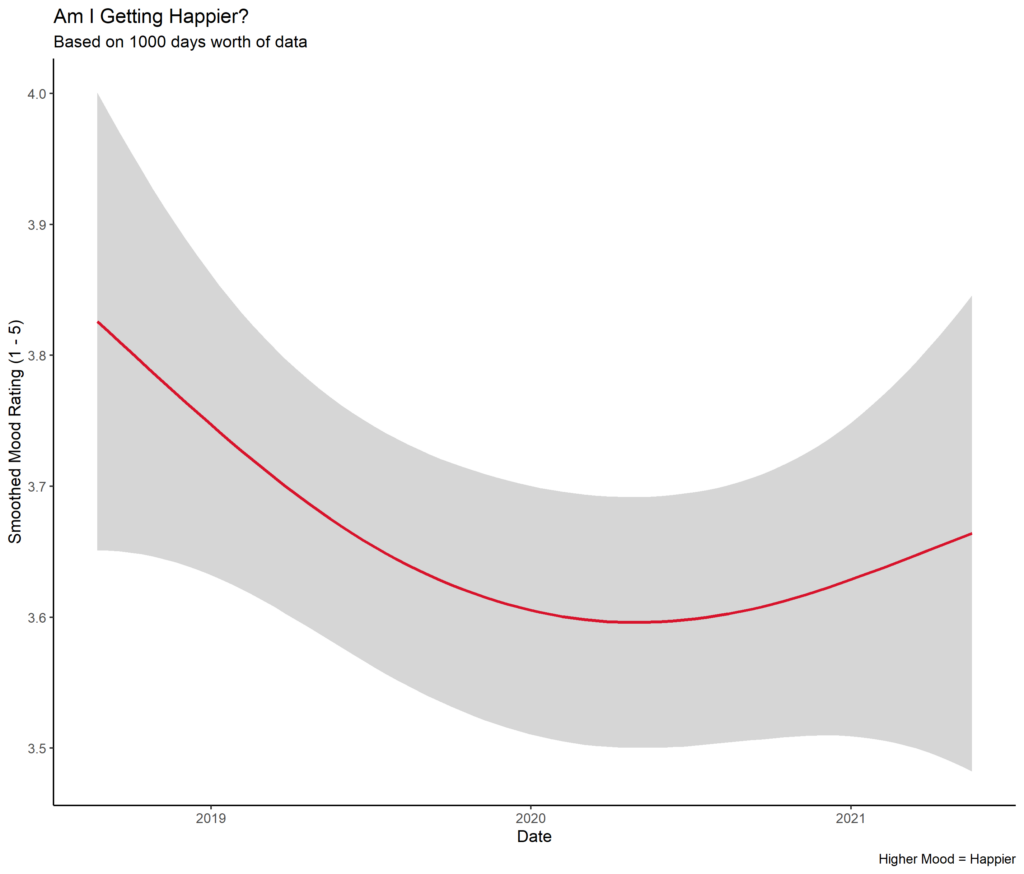
Both graphs below represent the smoothed mood rating over time with different scales for the y-axis. Different stories are told by the two graphs although they represent the exact same data. If we’re not careful, Figure 5 seems to indicate that my mood ratings have been dropping consistently. However, when we look closer, the range of values is roughly between 3.6 and 3.75. This drop could be entirely explained by early high ratings and random variation at both ends of the graph.
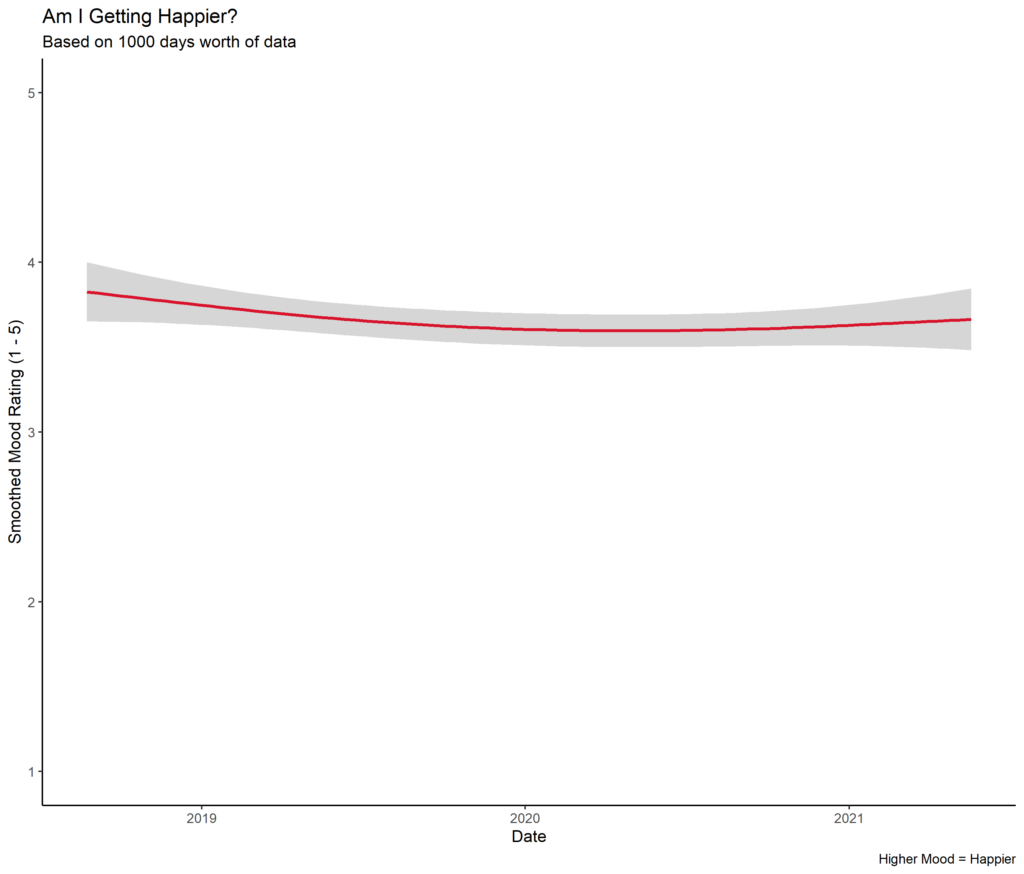
When we zoom out (Figure 6) and set the scale between 1 and 5 we see that the average mood and variability are consistent across the 1000 days.
Takeaways
It took about a year for cumulative values to stabilize. Nevertheless, monthly averages and standard deviations were fairly consistent. The good news is that you do not need to track your mood for 1000 days like I did to get a sense of your baseline. We can investigate many more questions with this dataset. Are there yearly trends? Is there a month or day of the week I tend to be happier? Did the COVID-19 pandemic affect my mood? Does meditation have an effect on my mood? I believe there are many nuggets to be found in the activities data.
This entire mood-tracking journey had the unintended effect of making me reflect on the nature of happiness. The simple fact of creating different moods for level 5 raises the issue that there may be more than one type of happiness. The same can be said about different types of suffering. What is the ideal mood distribution? Do I really want all my days to be fives with zero variability? I guess some variability could emerge from the different types of highs. One day could be spent in a blissful state, another spent doing meaningful work or attending a concert and experiencing pure extasis.
Knowing my baseline happiness levels and stability will be key to evaluating the effectiveness of habits that we are told we NEED to be doing. Should I keep meditating for one hour every day if my happiness levels did not rise after a year of practice? A deeper question that I am trying to answer for myself is:
Am I OK with never getting happier than I am now?
Olivier chabot