Let’s play an imaginary game. The game is called who’s the best at flipping coins. It is pretty simple. You flip a bunch of coins and whoever gets the most heads wins. To make this a little more interesting, though, not everybody has the same number of coins. Some people (Team Small) have only ten coins, while members of Team Big have a hundred each.
Jordan Ellenberg – How Not To Be Wrong (page 64)
It’s pretty obvious that the players of Team Big will have a huge advantage if we only look at the absolute number of heads. The typical player on Team Big can expect to observe approximately 50 heads out of their 100 flips. Similarly, a player on Team Small can expect to see around 5 heads out of their 10 flips. It is almost impossible for a player with only 10 flips to observe more heads than a player with 100 flips. This game is rigged.
Let’s try to make this game more fair. We can look at the proportion of heads since a fair coin has an expectation of 50% heads for both teams. Which team do you think will have the player with the highest proportion of heads?
Which team do you think will have the player with the highest proportion of heads?
Your intuition might tell you that Team Big has a better chance of having a higher proportion of heads since they flip more coins. That is certainly what my system 1 told me. However, let’s kickstart our system 2. Which option do you think is more likely to occur?
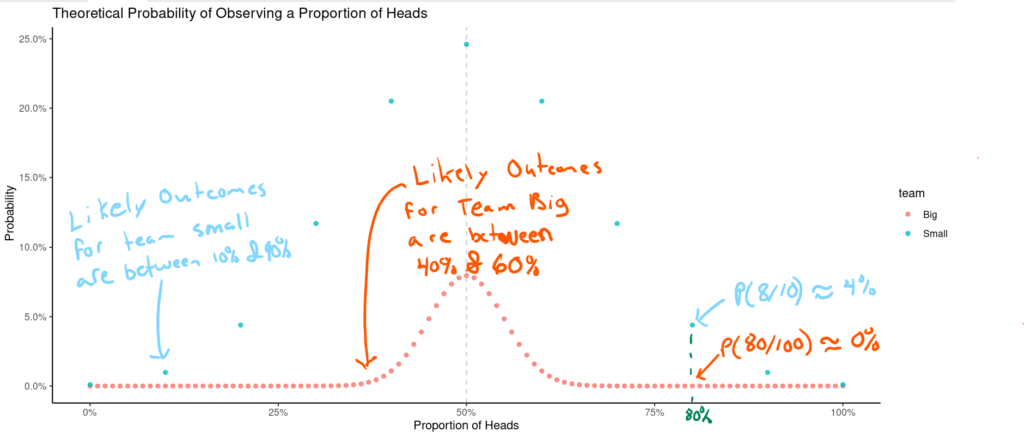
- A Team Small player flips 8 heads out of 10 flips (80% proprotion).
- A Team Big player flips 80 heads out of 100 flips (80% proprotion).
The Law of Large Numbers tells us that option 1 is far more likely to occur. In fact, we can expect to observe option 1 about 4 times out of 100 while only observing option 2 about 4 times out of 10 billion. In other words, it is approximately 100 million times more likely for option 1 to occur.
dbinom(x = 8, size = 10, prob = 0.5)
[1] 0.04394531
dbinom(x = 80, size = 100, prob = 0.5)
[1] 4.228163e-10
dbinom(x = 8, size = 10, prob = 0.5)/dbinom(x = 80, size = 100, prob = 0.5)
[1] 103934758
Thus, although we are using a fair coin, the game is still far from being fair. Team Small will almost certainly have the player with the highest proportion of heads.
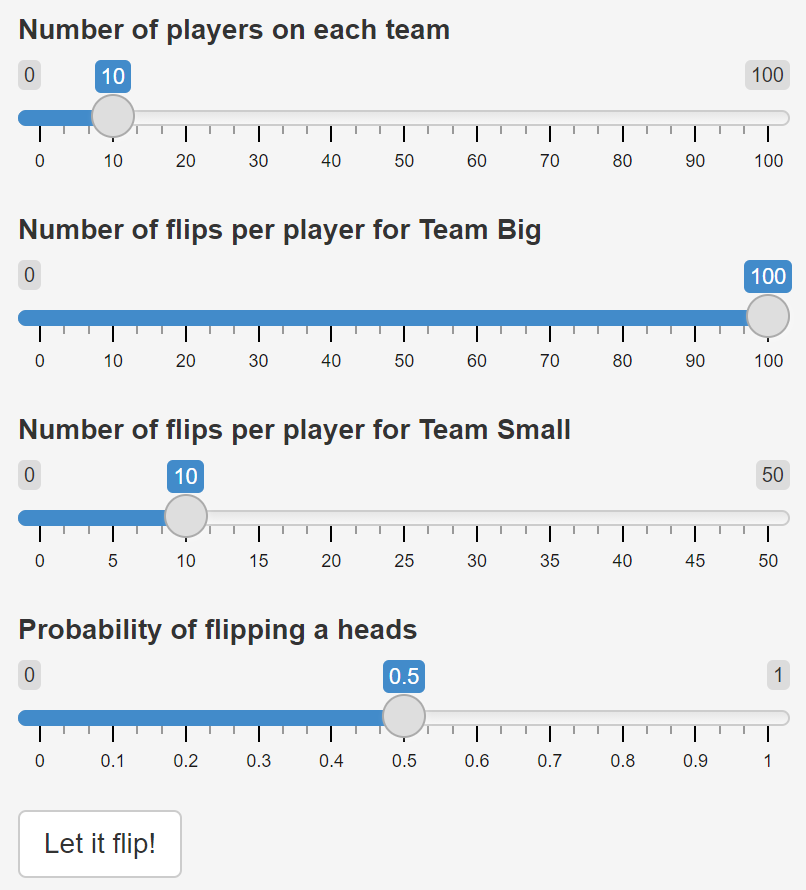
I have built this application to let you play this game and see for yourself. I used R and the Shiny framework to build the application. The code can be found on GitHub.

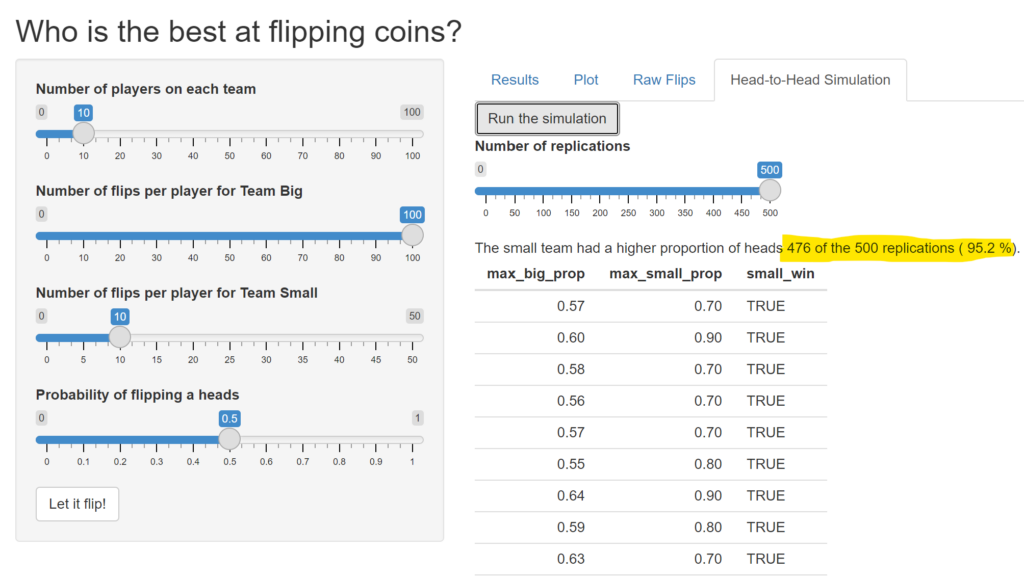
We can play this game many times and track which team has the player with the highest proportion of heads. It turns out that Team Small wins this game with 10 players on each team about 95% of the time.
Practical Implications
This game might not seem like much at first. However, the statistical mechanism behind the game might help us explain why smaller schools exhibit the highest standardized test scores. Your system 1 (your intuition) might tell you that big schools tend to have more resources which would raise the test scores. Alternatively, it might tell you that smaller schools will have smaller classes and better teacher-student ratios. We need our system 2 to explain to ourselves why smaller schools will almost always have the highest scores.
Imagine a school with a grade 9 class of 15 students versus a school with a grade 9 class of 300 students. Which school do you think is more likely to have an average score of 85% on the standardized test? Again, it is the smaller school. The Law of Large Numbers makes it very unlikely for the average score of the 300 students to be far from their “true ability”. However, the smaller class makes it more likely that a few students got lucky on the test and overperformed.
It would be extremely easy for school districts to conclude that they need smaller schools to perform better on standardized tests. They could construct stories after the fact of why smaller schools might be better. However, we would need to look at the average scores of the group of smaller schools versus the average of the group of bigger schools to see if those averages differ statistically speaking. My guess is that they probably would not differ universally across the world.
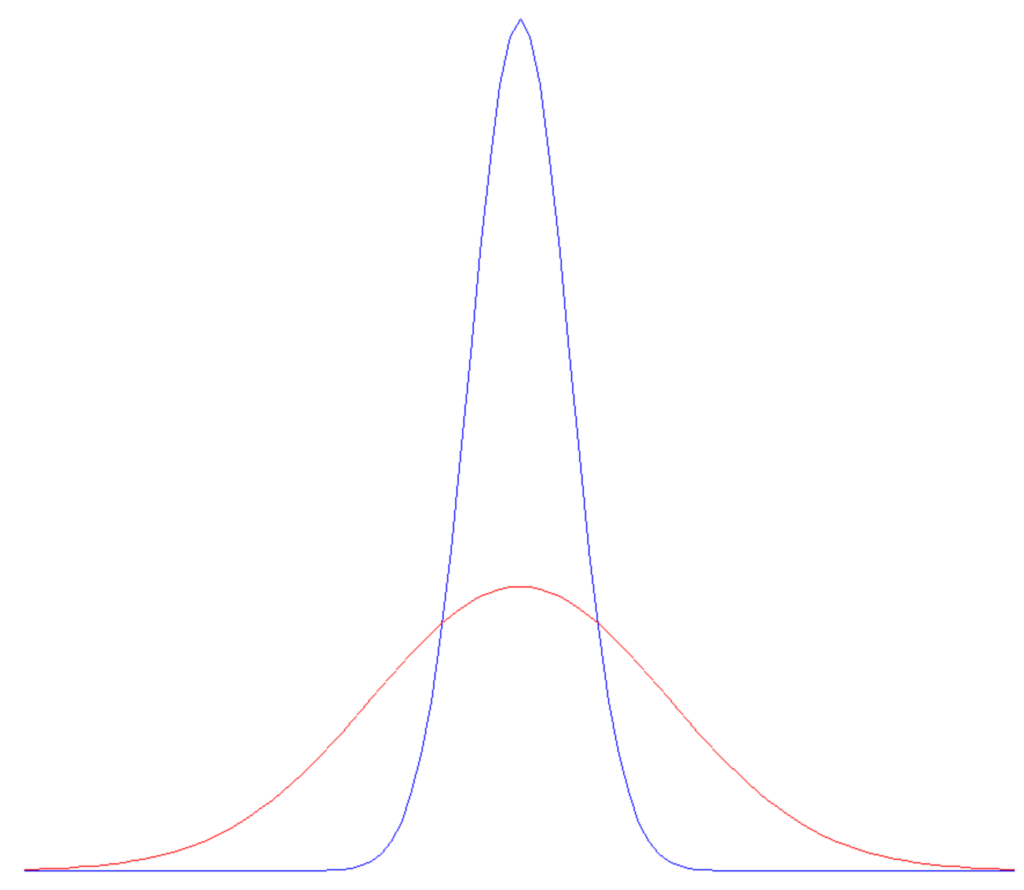
Two populations with equal averages can differ wildly in outcomes if their variances differ. Almost all the extreme outcomes will occur in the populations with more variance.
The first principle is that you must not fool yourself — and you are the easiest person to fool.
Richard Feynman
Articles you might like if you’ve enjoyed reading this one
- Is it Luck or is it Skill?
- Does it Make Sense to Buy Raffle Tickets?
- What I Learned from Tracking my Mood for 1000 days
- How To Read Research
- The Visual Display of Quantitative Information by Edward R. Tufte (2nd Edition)
- The Do-Nothing Morning Routine Experiment
- Hindsight Thoughts on Doing a Masters
Affiliate Links
- How Not To Be Wrong – Jordan Ellenberg
- Thinking, Fast & Slow – Daniel Kahneman
@JSEllenberg I created a Shiny app to explore your coin flipping game on page 65 of #HowNotToBeWrong.
— Olivier Chabot (@olivierchabot17) July 29, 2021
Good book so far! #SmallTeamWinshttps://t.co/BXnvrH8rCq pic.twitter.com/Lf9PmW8LD9